Working with multiple samples and coordinate systems#
%load_ext autoreload
%autoreload 2
Load libraries and create an empty spatialdata object that is backed by a zarr store.
import os

import tempfile
import uuid

from spatialdata import SpatialData

import sparrow as sp

sdata = SpatialData()

default_tmp_path = tempfile.gettempdir()

zarr_path = os.path.join(default_tmp_path, f"sdata_{uuid.uuid4()}.zarr")

sdata.write(zarr_path)
INFO     The Zarr backing store has been changed from None the new file path:
         /tmp/nix-shell.wcNPOY/sdata_078cd907-d199-4e81-b457-57d2d7fc8a8c.zarr
Add image layers.
from dask_image import imread
from spatialdata.transformations import Identity

from sparrow.datasets.registry import get_registry

registry = get_registry()
arr_a1_1 = imread.imread(registry.fetch("transcriptomics/resolve/mouse/20272_slide1_A1-1_DAPI.tiff"))
arr_a1_2 = imread.imread(registry.fetch("transcriptomics/resolve/mouse/20272_slide1_A1-2_DAPI.tiff"))

sdata = sp.im.add_image_layer(
    sdata,
    arr=arr_a1_1,
    output_layer="image_a1_1",
    transformations={"a1_1": Identity()},
    overwrite=True,
)

sdata = sp.im.add_image_layer(
    sdata,
    arr=arr_a1_2,
    output_layer="image_a1_2",
    transformations={"a1_2": Identity()},
    overwrite=True,
)
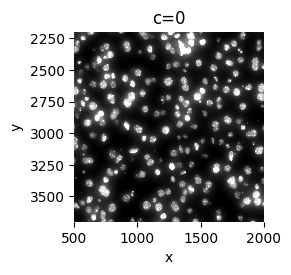
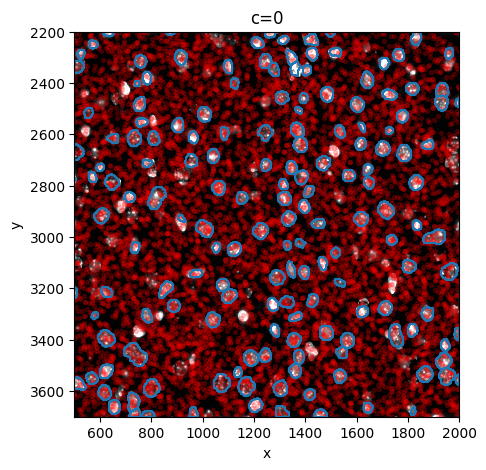
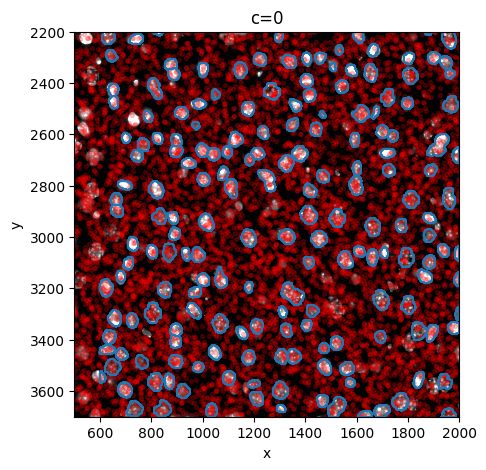
Specify coordinate system when plotting
sp.pl.plot_image(
sdata, img_layer="image_a1_1", to_coordinate_system="a1_1", crd=[500, 2000, 2200, 3700], figsize=(3, 3)
)
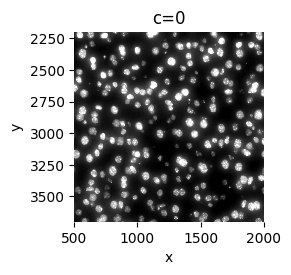
sp.pl.plot_image(
sdata, img_layer="image_a1_2", to_coordinate_system="a1_2", crd=[500, 2000, 2200, 3700], figsize=(3, 3)
)
Do some image processing on full image, no need to specify a coordinate system
sdata = sp.im.min_max_filtering(
    sdata, img_layer="image_a1_1", output_layer="image_a1_1_min_max", size_min_max_filter=40, overwrite=True
)
When doing some image processing on a crop, you need to specify the coordinate system to which the crop is defined
sdata = sp.im.min_max_filtering(
    sdata,
    img_layer="image_a1_1",
    output_layer="image_a1_1_min_max",
    size_min_max_filter=40,
    crd=[500, 2000, 2200, 3700],
    to_coordinate_system="a1_1",
    overwrite=True,
)
sdata = sp.im.min_max_filtering(
    sdata,
    img_layer="image_a1_2",
    output_layer="image_a1_2_min_max",
    size_min_max_filter=40,
    crd=[500, 2000, 2200, 3700],
    to_coordinate_system="a1_2",
    overwrite=True,
)
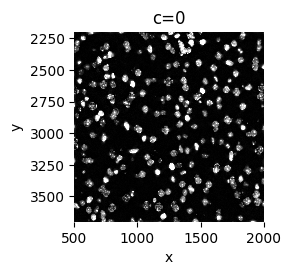
sp.pl.plot_image(
    sdata,
    img_layer="image_a1_1_min_max",
    to_coordinate_system="a1_1",
    figsize=(3, 3),
)
Now do segmentation
# no need to specify coordinate system if no crop is specifed
sdata = sp.im.segment(
    sdata,
    img_layer="image_a1_1_min_max",
    output_labels_layer="labels_a1_1",
    output_shapes_layer="shapes_a1_1",
    overwrite=True,
    crd=None,
)

# but need to specify to_coordinate_system when crop is defined

sdata = sp.im.segment(
    sdata,
    img_layer="image_a1_2_min_max",
    output_labels_layer="labels_a1_2",
    output_shapes_layer="shapes_a1_2",
    overwrite=True,
    crd=[600, 2000, 2200, 3700],
    to_coordinate_system="a1_2",
)
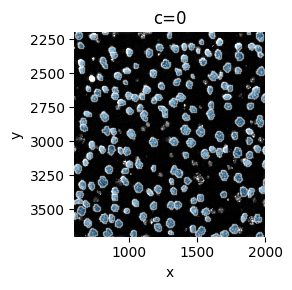
sp.pl.plot_shapes(
    sdata,
    img_layer="image_a1_2_min_max",
    shapes_layer="shapes_a1_2",
    to_coordinate_system="a1_2",
    crd=[600, 2000, 2200, 3700],
    figsize=(3, 3),
)
Read the transcripts downloaded previously. Currently, the transformation specified on the transcripts is always the Identity transformation. The transcripts should be registered with the coordinate system of the image layer via an affine transform matrix that can be specified via the parameter path_transform_matrix. If not specified, the identity matrix will be used.
path_points_a1_1 = registry.fetch("transcriptomics/resolve/mouse/20272_slide1_A1-1_results.txt")
path_points_a1_2 = registry.fetch("transcriptomics/resolve/mouse/20272_slide1_A1-2_results.txt")

kwargs = {
    "column_x": 0,
    "column_y": 1,
    "column_gene": 3,
    "delimiter": "\t",
    "header": None,
    "overwrite": True,
}

sdata = sp.io.read_transcripts(
    sdata, path_count_matrix=path_points_a1_1, to_coordinate_system="a1_1", output_layer="points_a1_1", **kwargs
)

sdata = sp.io.read_transcripts(
    sdata, path_count_matrix=path_points_a1_2, to_coordinate_system="a1_2", output_layer="points_a1_2", **kwargs
)
Verify that transformation associated to points layer is indeed the identity, and verify that shapes and labels have same transformation associated to them.
from spatialdata.transformations import get_transformation

print("points:\n", get_transformation(sdata["points_a1_2"], get_all=True))
print(
    "image\n", get_transformation(sdata["image_a1_2_min_max"], get_all=True)
)  # one crop was taken, so one translation is defined on image.
print(
    "labels:\n", get_transformation(sdata["labels_a1_2"], get_all=True)
)  # two times a crop was taken, so a sequence of two translations is defined on labels/shapes.
print(
    "shapes:\n", get_transformation(sdata["shapes_a1_2"], get_all=True)
)  # same transformation defined on associated shapes layer.
points:
 {'a1_2': Identity }
image
 {'a1_2': Sequence
    Translation (c, y, x)
        [   0. 2200.  500.]
    Identity }
labels:
 {'a1_2': Sequence
    Translation (y, x)
        [  0. 100.]
    Sequence
        Translation (y, x)
            [2200.  500.]
        Identity }
shapes:
 {'a1_2': Sequence
    Translation (x, y)
        [100.   0.]
    Sequence
        Translation (x, y)
            [ 500. 2200.]
        Identity }
sp.pl.sanity(
    sdata,
    img_layer="image_a1_1_min_max",
    shapes_layer="shapes_a1_1",
    points_layer="points_a1_1",
    to_coordinate_system="a1_1",
    figsize=(5, 5),
    n_sample=10000,
)
sp.pl.sanity(
    sdata,
    img_layer="image_a1_2_min_max",
    shapes_layer="shapes_a1_2",
    points_layer="points_a1_2",
    to_coordinate_system="a1_2",
    figsize=(5, 5),
    n_sample=10000,
)
sdata = sp.tb.allocate(
    sdata,
    labels_layer="labels_a1_1",
    points_layer="points_a1_1",
    to_coordinate_system="a1_1",
    output_layer="table",
    append=False,
    overwrite=True,
)

# append gene count of labels_a1_2 and points_a1_2 to anndata object with name 'table'
sdata = sp.tb.allocate(
    sdata,
    labels_layer="labels_a1_2",
    points_layer="points_a1_2",
    to_coordinate_system="a1_2",
    output_layer="table",
    append=True,
    overwrite=True,
)
sdata = sp.tb.preprocess_transcriptomics(
    sdata,
    labels_layer=["labels_a1_1", "labels_a1_2"],
    table_layer="table",
    output_layer="table_preprocessed",
    overwrite=True,
)  # we can also choose to set output_layer equal to 'table'.
sdata = sp.tb.filter_on_size(
    sdata,
    labels_layer=["labels_a1_1", "labels_a1_2"],
    table_layer="table_preprocessed",
    output_layer="table_filtered",
    min_size=1000,
    overwrite=True,
)
sdata
SpatialData object, with associated Zarr store: /tmp/nix-shell.wcNPOY/sdata_078cd907-d199-4e81-b457-57d2d7fc8a8c.zarr
├── Images
│     ├── 'image_a1_1': DataArray[cyx] (1, 12864, 10720)
│     ├── 'image_a1_1_min_max': DataArray[cyx] (1, 1500, 1500)
│     ├── 'image_a1_2': DataArray[cyx] (1, 10720, 8576)
│     └── 'image_a1_2_min_max': DataArray[cyx] (1, 1500, 1500)
├── Labels
│     ├── 'labels_a1_1': DataArray[yx] (1500, 1500)
│     └── 'labels_a1_2': DataArray[yx] (1500, 1400)
├── Points
│     ├── 'points_a1_1': DataFrame with shape: (<Delayed>, 3) (2D points)
│     └── 'points_a1_2': DataFrame with shape: (<Delayed>, 3) (2D points)
├── Shapes
│     ├── 'filtered_low_counts_shapes_a1_1': GeoDataFrame shape: (5, 1) (2D shapes)
│     ├── 'filtered_low_counts_shapes_a1_2': GeoDataFrame shape: (1, 1) (2D shapes)
│     ├── 'filtered_size_shapes_a1_1': GeoDataFrame shape: (28, 1) (2D shapes)
│     ├── 'filtered_size_shapes_a1_2': GeoDataFrame shape: (16, 1) (2D shapes)
│     ├── 'shapes_a1_1': GeoDataFrame shape: (132, 1) (2D shapes)
│     └── 'shapes_a1_2': GeoDataFrame shape: (164, 1) (2D shapes)
└── Tables
      ├── 'table': AnnData (346, 68)
      ├── 'table_filtered': AnnData (296, 59)
      └── 'table_preprocessed': AnnData (340, 59)
with coordinate systems:
    ▸ 'a1_1', with elements:
        image_a1_1 (Images), image_a1_1_min_max (Images), labels_a1_1 (Labels), points_a1_1 (Points), filtered_low_counts_shapes_a1_1 (Shapes), filtered_size_shapes_a1_1 (Shapes), shapes_a1_1 (Shapes)
    ▸ 'a1_2', with elements:
        image_a1_2 (Images), image_a1_2_min_max (Images), labels_a1_2 (Labels), points_a1_2 (Points), filtered_low_counts_shapes_a1_2 (Shapes), filtered_size_shapes_a1_2 (Shapes), shapes_a1_2 (Shapes)
assert sdata["table_filtered"].shape[0] == len(sdata["shapes_a1_1"]) + len(sdata["shapes_a1_2"])
from sparrow.utils._keys import _REGION_KEY

for to_coordinate_system in ["a1_1", "a1_2"]:
    assert sdata["table"][sdata["table"].obs[_REGION_KEY] == f"labels_{to_coordinate_system}"].shape[0] == len(
        sdata[f"shapes_{to_coordinate_system}"]
    ) + len(sdata[f"filtered_low_counts_shapes_{to_coordinate_system}"]) + len(
        sdata[f"filtered_size_shapes_{to_coordinate_system}"]
    )
zarr_path = os.path.join(default_tmp_path, f"sdata_{uuid.uuid4()}.zarr")  # output path for queried sdata

labels_layer = [
    "labels_a1_1",
    "labels_a1_2",
]
crd = [
    (600, 1000, 2300, 3000),
    (700, 1000, 2300, 2500),
]
to_coordinate_system = ["a1_1", "a1_2"]

sdata_queried = sp.utils.bounding_box_query(
    sdata,
    labels_layer=labels_layer,
    crd=crd,
    to_coordinate_system=to_coordinate_system,
    copy_img_layer=False,
    copy_shapes_layer=False,
    copy_points_layer=False,
    output=zarr_path,
)

for _labels_layer in labels_layer:
    assert _labels_layer in sdata_queried.labels
INFO     The Zarr backing store has been changed from None the new file path:
         /tmp/nix-shell.wcNPOY/sdata_c66bfa43-1b79-4cc6-9195-c7f37270e264.zarr