Tutorial for the Analysis of Visium HD Data#
This tutorial demonstrates how to analyze 10x Genomics Visium HD spatial transcriptomics data using the SPArrOW pipeline.
What you will learn:
How to read and visualize Visium HD data (H&E image + gene expression bins)
How to use the default 2 µm, 8 µm, and 16 µm bin resolutions provided by 10x
How to achieve single-cell resolution by assigning bins to segmented nuclei, either using a pre-made mask from 10x or by running Cellpose yourself
Dataset: Mouse small intestine (10x Genomics public dataset)
# lets you automatically reload modules when their source code changes
%load_ext autoreload
# reload all modules (except those excluded by %aimport) every time before executing the Python code
%autoreload 2
# allows you to display matplotlib plots directly in the notebook
%matplotlib inline
Package imports#
import os, sys
import tempfile
from datetime import datetime

import geopandas as gpd
import matplotlib as mlp
import matplotlib.pyplot as plt
import pooch
import sparrow as sp
from spatialdata.transformations import Identity, set_transformation

from sparrow.datasets.registry import get_registry
from sparrow.io._visium_hd import visium_hd
from sparrow.plot._plot import plot as _plot
font_size = 10
plot_dpi = 250
save_dpi = 500
# Setting fonts, line widths, and figure resolution for all plots in this tutorial:
mlp.rcParams.update({
    "font.family": "serif",
    "axes.titlesize": font_size + 3,
    "axes.titleweight": "bold",
    "axes.labelsize": font_size,
    "xtick.labelsize": font_size,
    "ytick.labelsize": font_size,
    "lines.linewidth": 1.5,
    "figure.dpi": plot_dpi,
})
Specifying paths#
# Cache directory for pooch to store downloaded files (adjust as needed)
# Make sure the directory is not too large and has enough space for the downloaded data
CACHE_DIR = "C:/Users/stijnb/Documents/Sparrow"

# The directory where the spatialdata .zarr will be saved.
# You can change this to any directory you prefer, but using a temporary directory is often convenient for tutorials and testing.
OUTPUT_DIR = tempfile.gettempdir()

# The coordinate system for the Visium HD mouse small intestine dataset.
COORDINATE_SYSTEM = "Visium_HD_Mouse_Small_Intestine"
1. Read in the data#
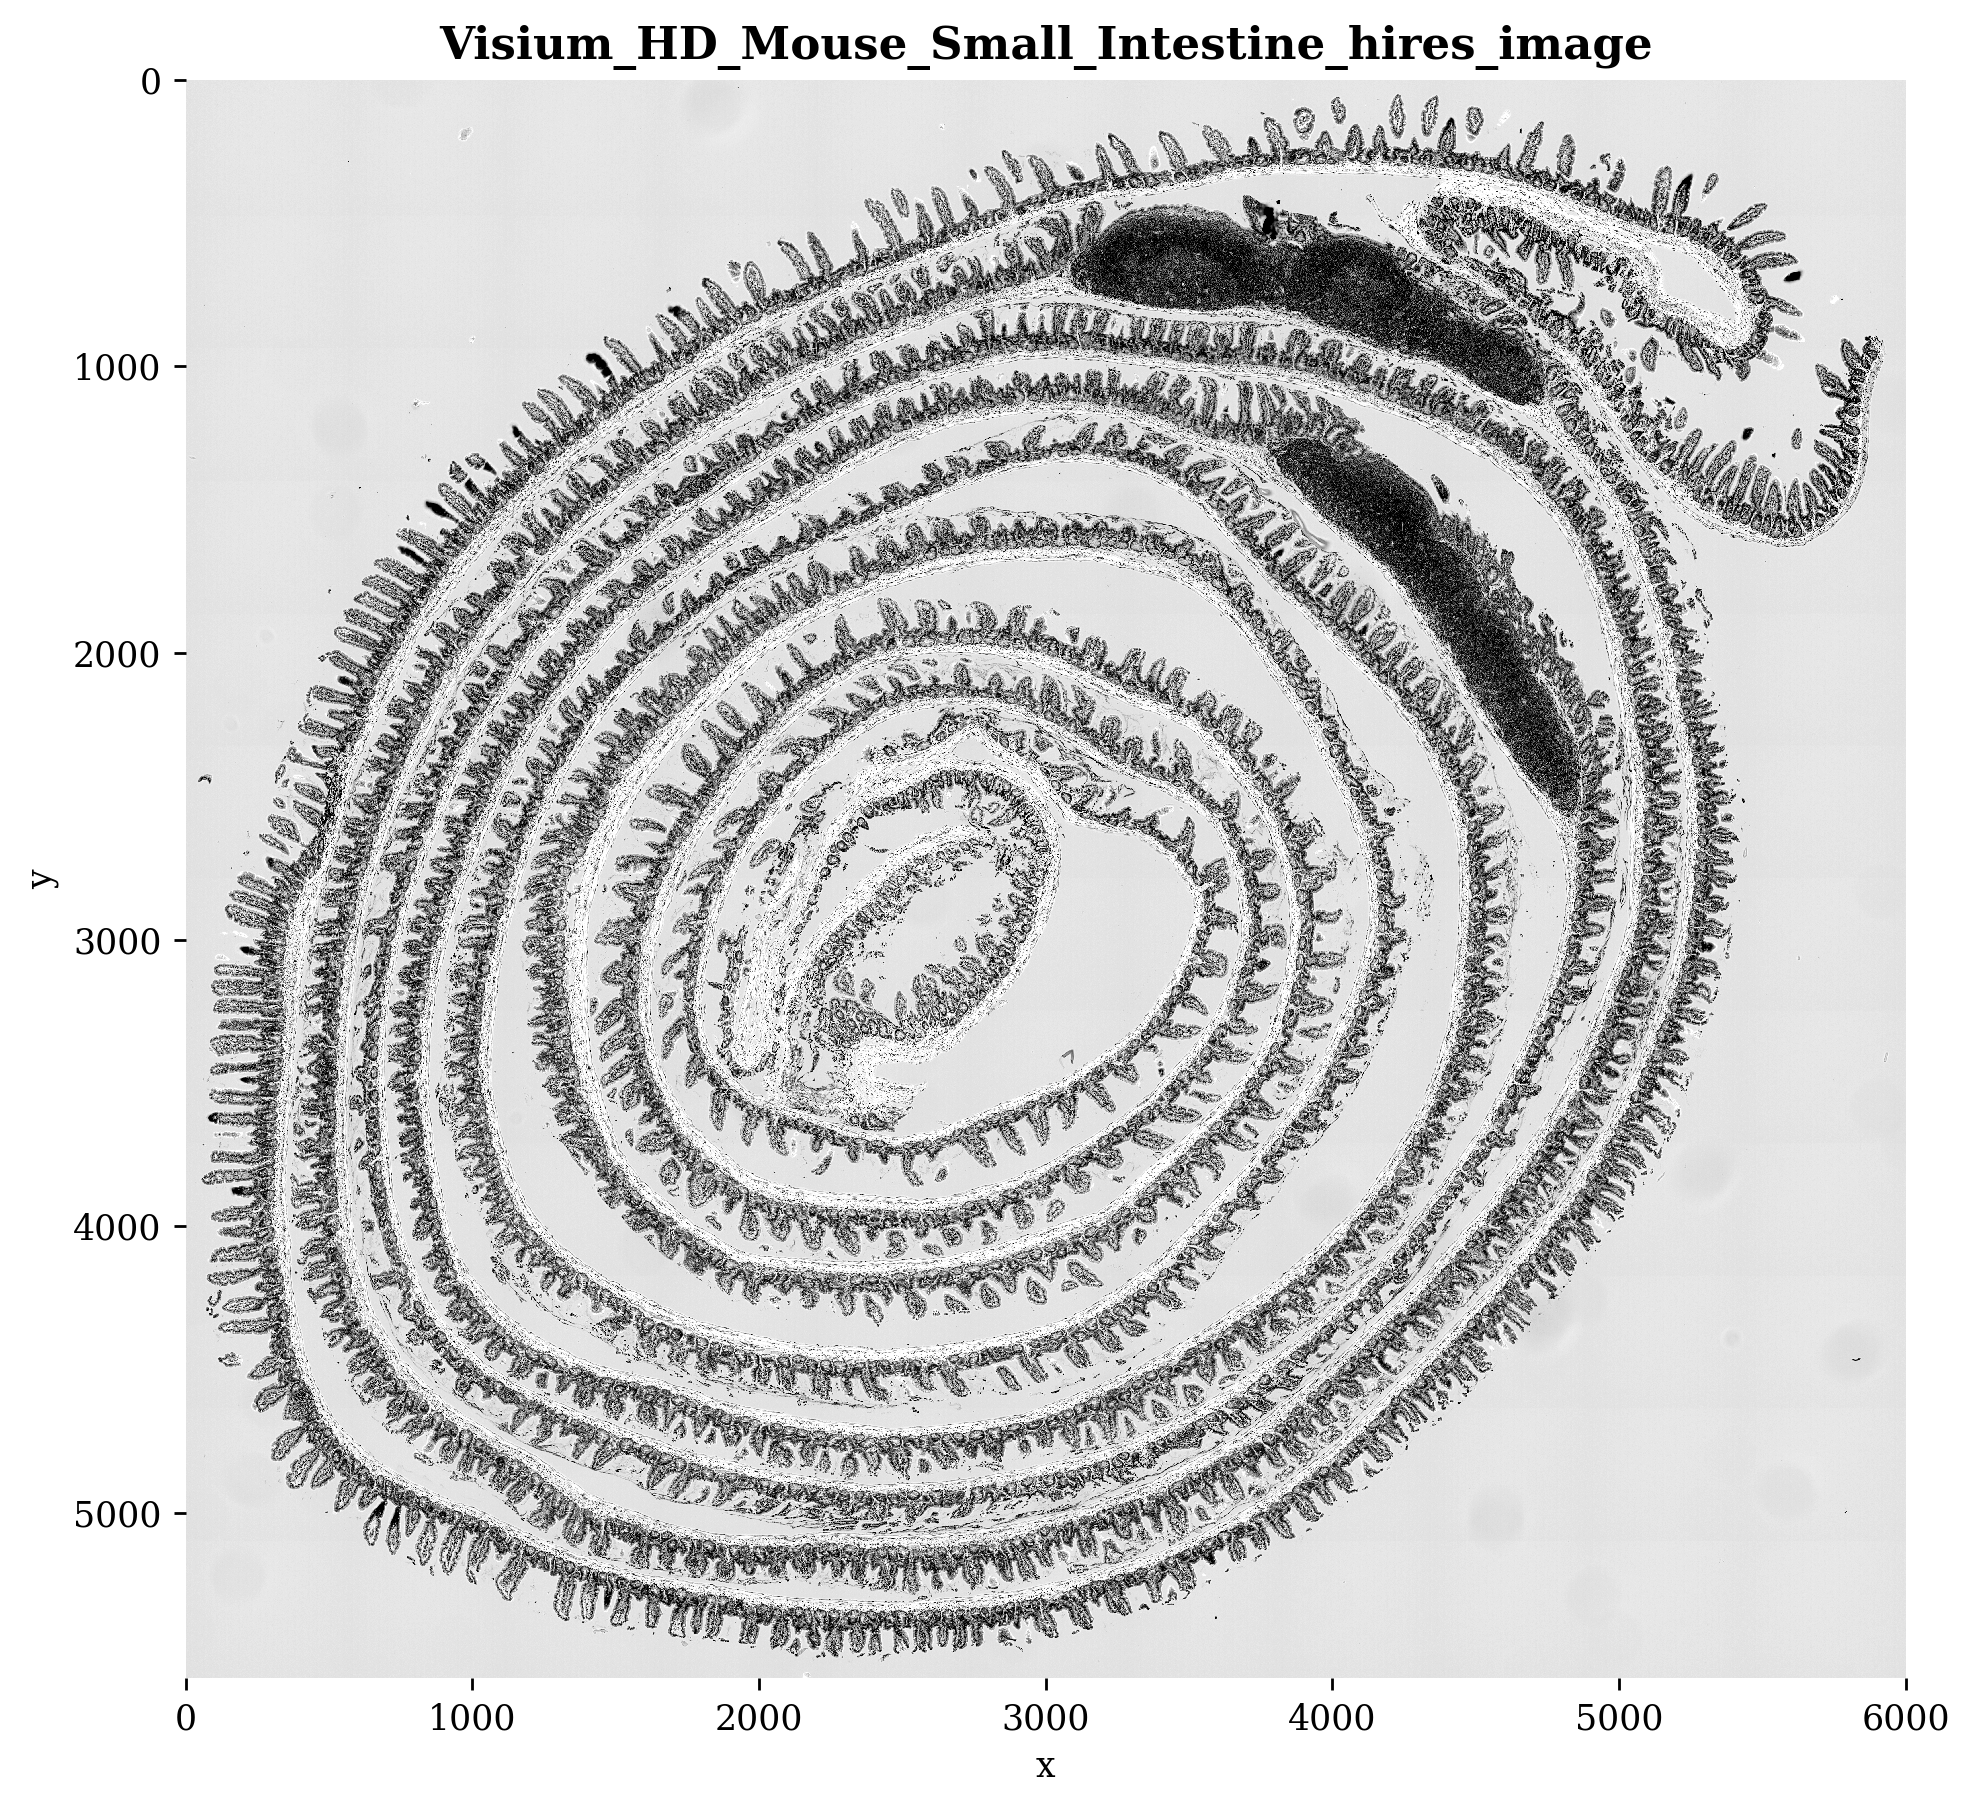
The first step of the SPArrOW pipeline includes reading in the raw data. The example dataset for this notebook will be downloaded and cached using pooch via sparrow.dataset.registry. It is the mouse small intestine public dataset of 10X Genomics, further information on this dataset can be found here.
registry = get_registry(path=CACHE_DIR)

unzip_path = registry.fetch(
        "transcriptomics/visium_hd/mouse/visium_hd_mouse_small_intestine.zip",
        processor=pooch.Unzip(),
    )
path = os.path.commonpath(unzip_path)
The SpatialData object will be saved a temporary Zarr store (.zarr directory). Zarr is a chunked, compressed array format that enables efficient read/write of large multi-dimensional arrays. A timestamped name is used here to avoid accidentally overwriting a previous run.
zarr_path = os.path.join(OUTPUT_DIR, f"sdata_{datetime.now():%Y%m%d_%H%M%S}.zarr")
The resulting sdata object is a SpatialData container displayed below. All elements share a common coordinate system (Visium_HD_Mouse_Small_Intestine) so that images, shapes, and tables are spatially aligned.
sdata = visium_hd(
        path=path,
        bin_size=[2,8,16],
        dataset_id="Visium_HD_Mouse_Small_Intestine",
        bins_as_squares=True,
        output= zarr_path,
    )
sdata
INFO     The instance_key column in 'table.obs' ('table.obs[location_id]') will be relabeled to ensure a numeric
         data type, with a continuous range and without including the value 0 (which is reserved for the
         background). The new labels will be stored in a new column named 'relabeled_location_id'.
INFO     The Zarr backing store has been changed from None the new file path:
         C:\Users\stijnb\AppData\Local\Temp\sdata_20260610_114301.zarr
SpatialData object, with associated Zarr store: C:\Users\stijnb\AppData\Local\Temp\sdata_20260610_114301.zarr
├── Images
│     ├── 'Visium_HD_Mouse_Small_Intestine_full_image': DataTree[cyx] (3, 21943, 23618), (3, 10971, 11809), (3, 5485, 5904), (3, 2742, 2952), (3, 1371, 1476)
│     ├── 'Visium_HD_Mouse_Small_Intestine_hires_image': DataArray[cyx] (3, 5575, 6000)
│     └── 'Visium_HD_Mouse_Small_Intestine_lowres_image': DataArray[cyx] (3, 558, 600)
├── Labels
│     ├── 'Visium_HD_Mouse_Small_Intestine_square_002um_labels': DataArray[yx] (3285, 3191)
│     ├── 'Visium_HD_Mouse_Small_Intestine_square_008um_labels': DataArray[yx] (822, 799)
│     └── 'Visium_HD_Mouse_Small_Intestine_square_016um_labels': DataArray[yx] (412, 400)
├── Shapes
│     ├── 'Visium_HD_Mouse_Small_Intestine_square_002um': GeoDataFrame shape: (5479660, 1) (2D shapes)
│     ├── 'Visium_HD_Mouse_Small_Intestine_square_008um': GeoDataFrame shape: (351817, 1) (2D shapes)
│     └── 'Visium_HD_Mouse_Small_Intestine_square_016um': GeoDataFrame shape: (91033, 1) (2D shapes)
└── Tables
      ├── 'square_002um': AnnData (5479660, 19059)
      ├── 'square_008um': AnnData (351817, 19059)
      └── 'square_016um': AnnData (91033, 19059)
with coordinate systems:
    ▸ 'Visium_HD_Mouse_Small_Intestine', with elements:
        Visium_HD_Mouse_Small_Intestine_full_image (Images), Visium_HD_Mouse_Small_Intestine_hires_image (Images), Visium_HD_Mouse_Small_Intestine_lowres_image (Images), Visium_HD_Mouse_Small_Intestine_square_002um_labels (Labels), Visium_HD_Mouse_Small_Intestine_square_008um_labels (Labels), Visium_HD_Mouse_Small_Intestine_square_016um_labels (Labels), Visium_HD_Mouse_Small_Intestine_square_002um (Shapes), Visium_HD_Mouse_Small_Intestine_square_008um (Shapes), Visium_HD_Mouse_Small_Intestine_square_016um (Shapes)
    ▸ 'Visium_HD_Mouse_Small_Intestine_downscaled_hires', with elements:
        Visium_HD_Mouse_Small_Intestine_hires_image (Images), Visium_HD_Mouse_Small_Intestine_square_002um_labels (Labels), Visium_HD_Mouse_Small_Intestine_square_008um_labels (Labels), Visium_HD_Mouse_Small_Intestine_square_016um_labels (Labels), Visium_HD_Mouse_Small_Intestine_square_002um (Shapes), Visium_HD_Mouse_Small_Intestine_square_008um (Shapes), Visium_HD_Mouse_Small_Intestine_square_016um (Shapes)
    ▸ 'Visium_HD_Mouse_Small_Intestine_downscaled_lowres', with elements:
        Visium_HD_Mouse_Small_Intestine_lowres_image (Images), Visium_HD_Mouse_Small_Intestine_square_002um_labels (Labels), Visium_HD_Mouse_Small_Intestine_square_008um_labels (Labels), Visium_HD_Mouse_Small_Intestine_square_016um_labels (Labels), Visium_HD_Mouse_Small_Intestine_square_002um (Shapes), Visium_HD_Mouse_Small_Intestine_square_008um (Shapes), Visium_HD_Mouse_Small_Intestine_square_016um (Shapes)
sp.pl.plot_image(
    sdata,
    img_layer="Visium_HD_Mouse_Small_Intestine_hires_image",
    figsize=(8, 8),
    to_coordinate_system="Visium_HD_Mouse_Small_Intestine_downscaled_hires",
    channel="r",
    channel_title=False,
    img_title=True
)
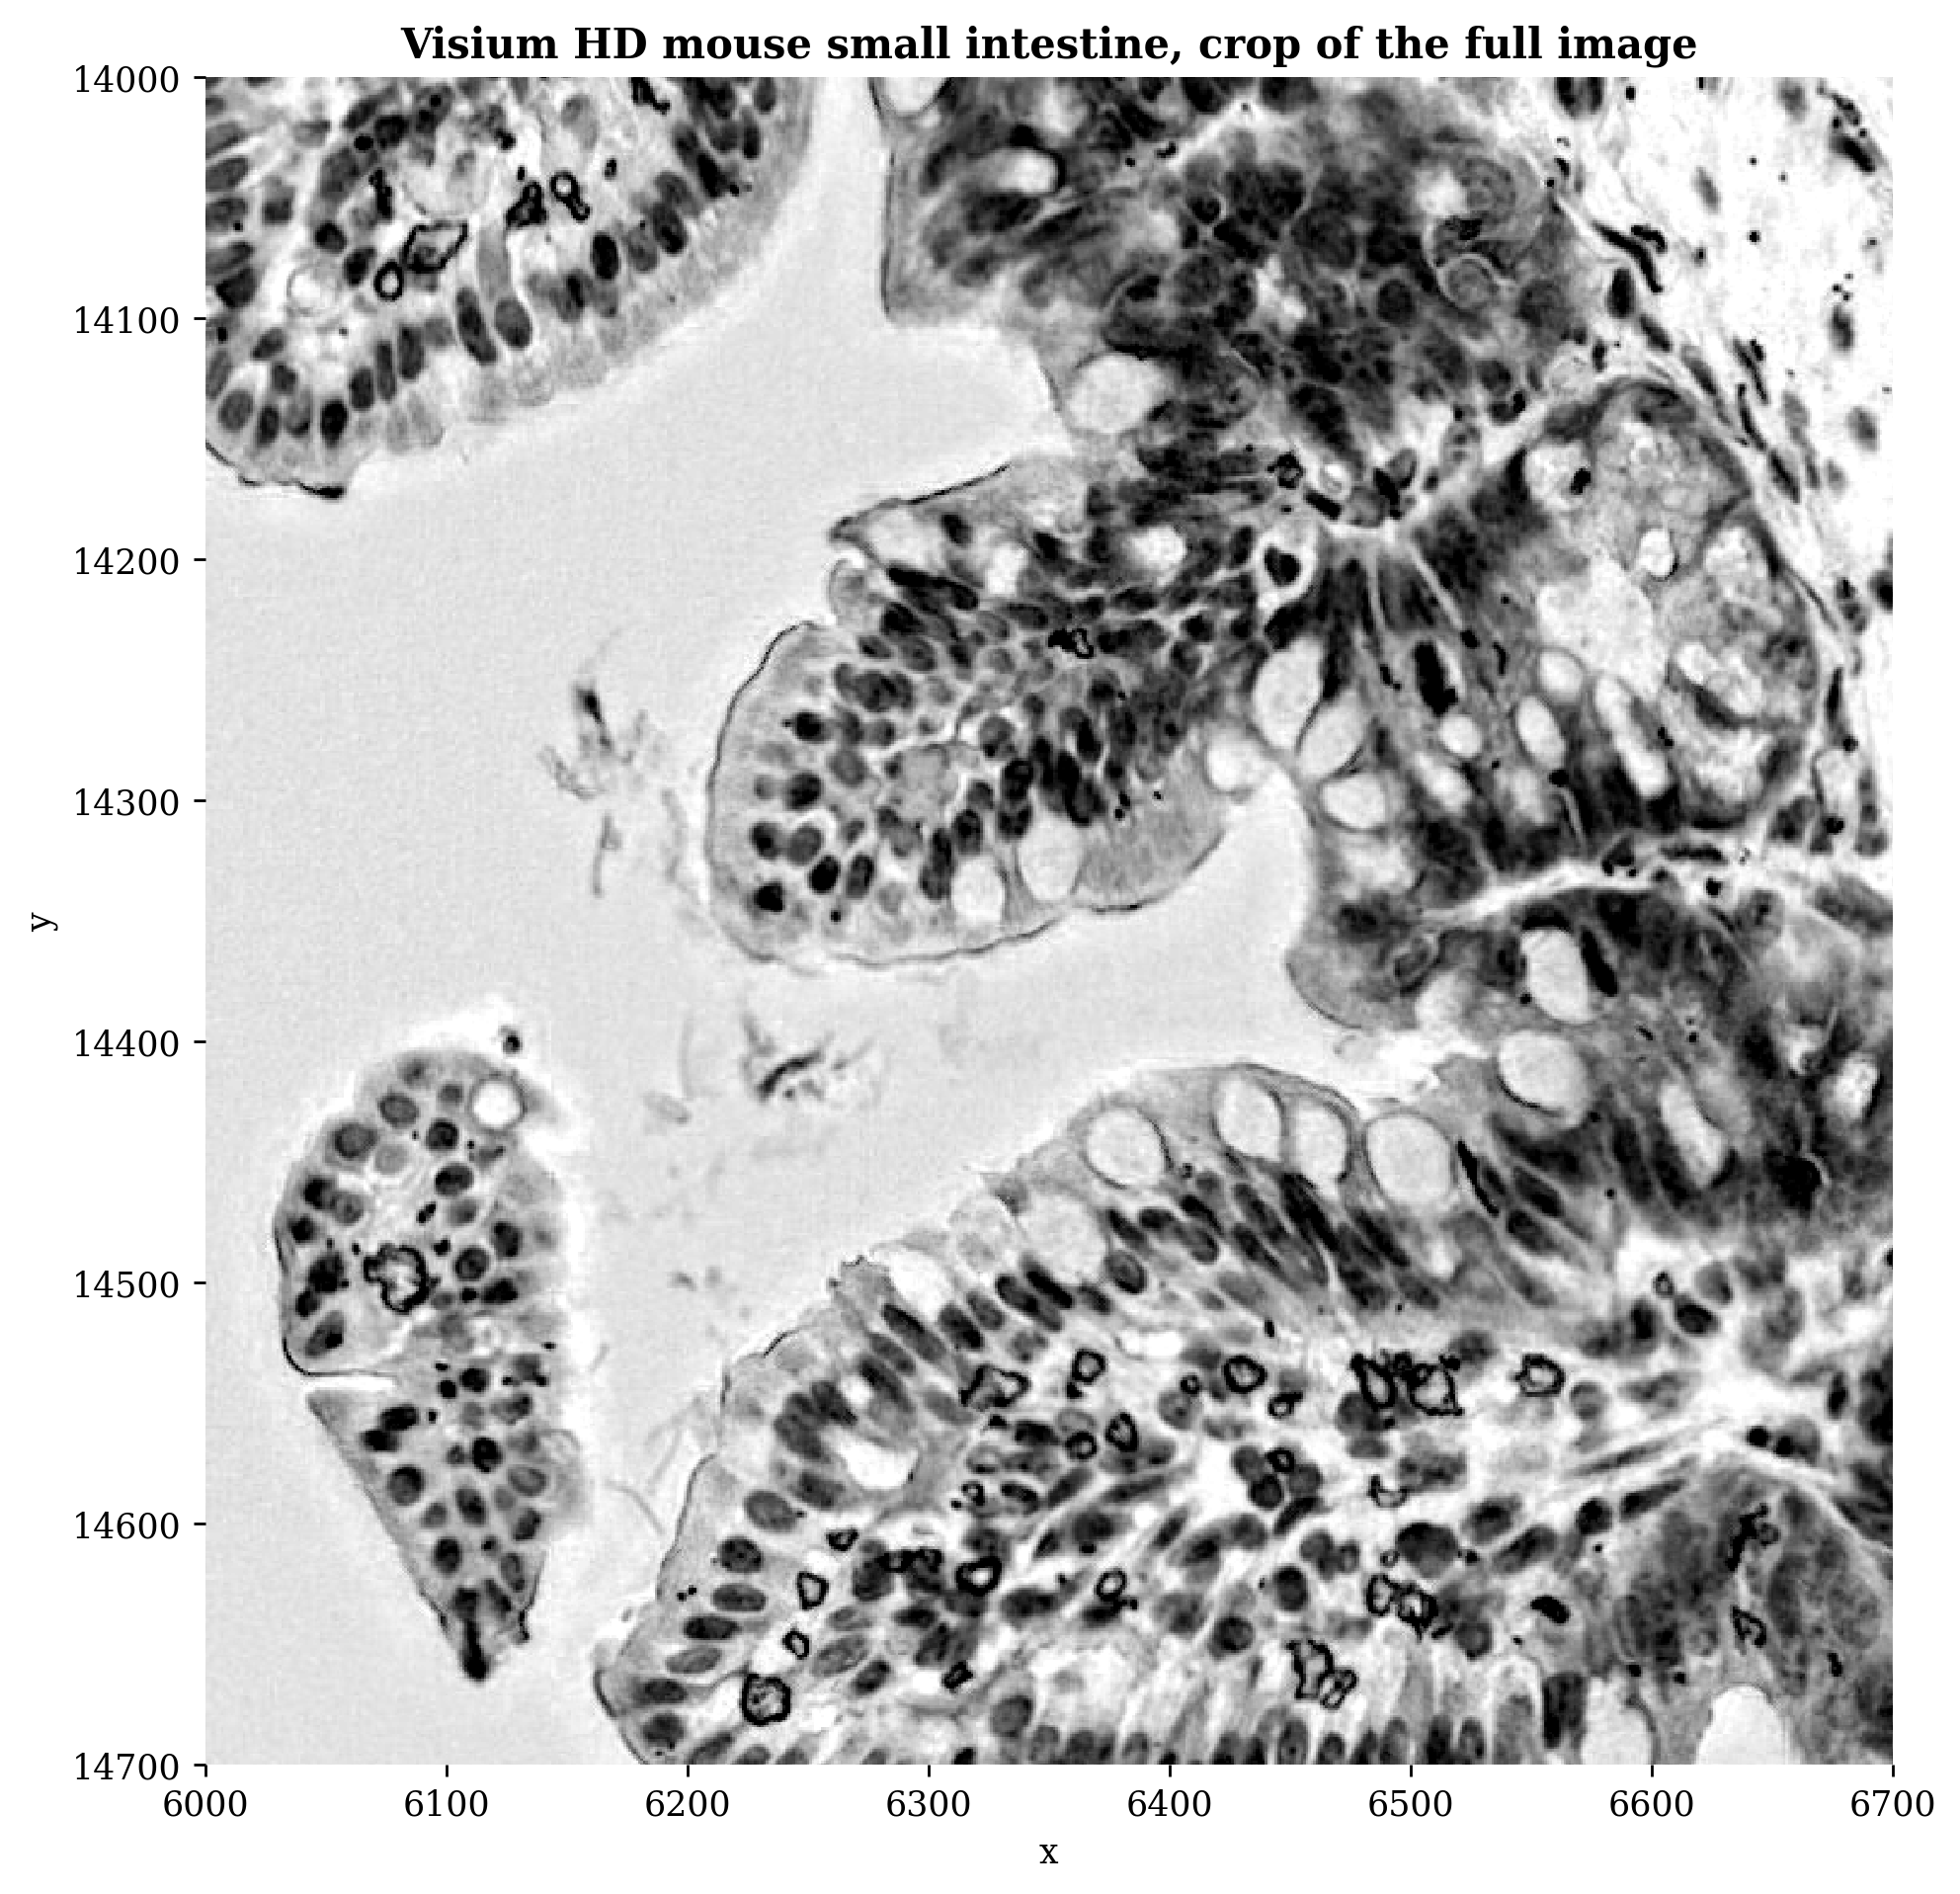
We can take a closer look by cropping the image, if we want the best resolution we can plot the Visium_HD_Mouse_Small_Intestine_full_image, however, keep in mind that if you would plot the whole image without cropping, this could take some more time.
# Coordinates used for visualization purposes, to zoom in on a specific region of the image.
# Adjust the coordinates as needed to focus on different areas of the image.
offset = 700
crd = [6000, 6000 + offset, 14000, 14000 + offset]

fig, ax = plt.subplots(figsize=(8, 8), dpi=plot_dpi)

_plot(
    sdata=sdata,
    ax=ax,
    img_layer="Visium_HD_Mouse_Small_Intestine_full_image",
    shapes_layer=None,
    crd=crd,
    to_coordinate_system=COORDINATE_SYSTEM,
    channel="r",
    channel_title=False,
    img_title=False,
 )
ax.set_title("Visium HD mouse small intestine, crop of the full image", fontsize=12)
plt.tight_layout()
plt.show()
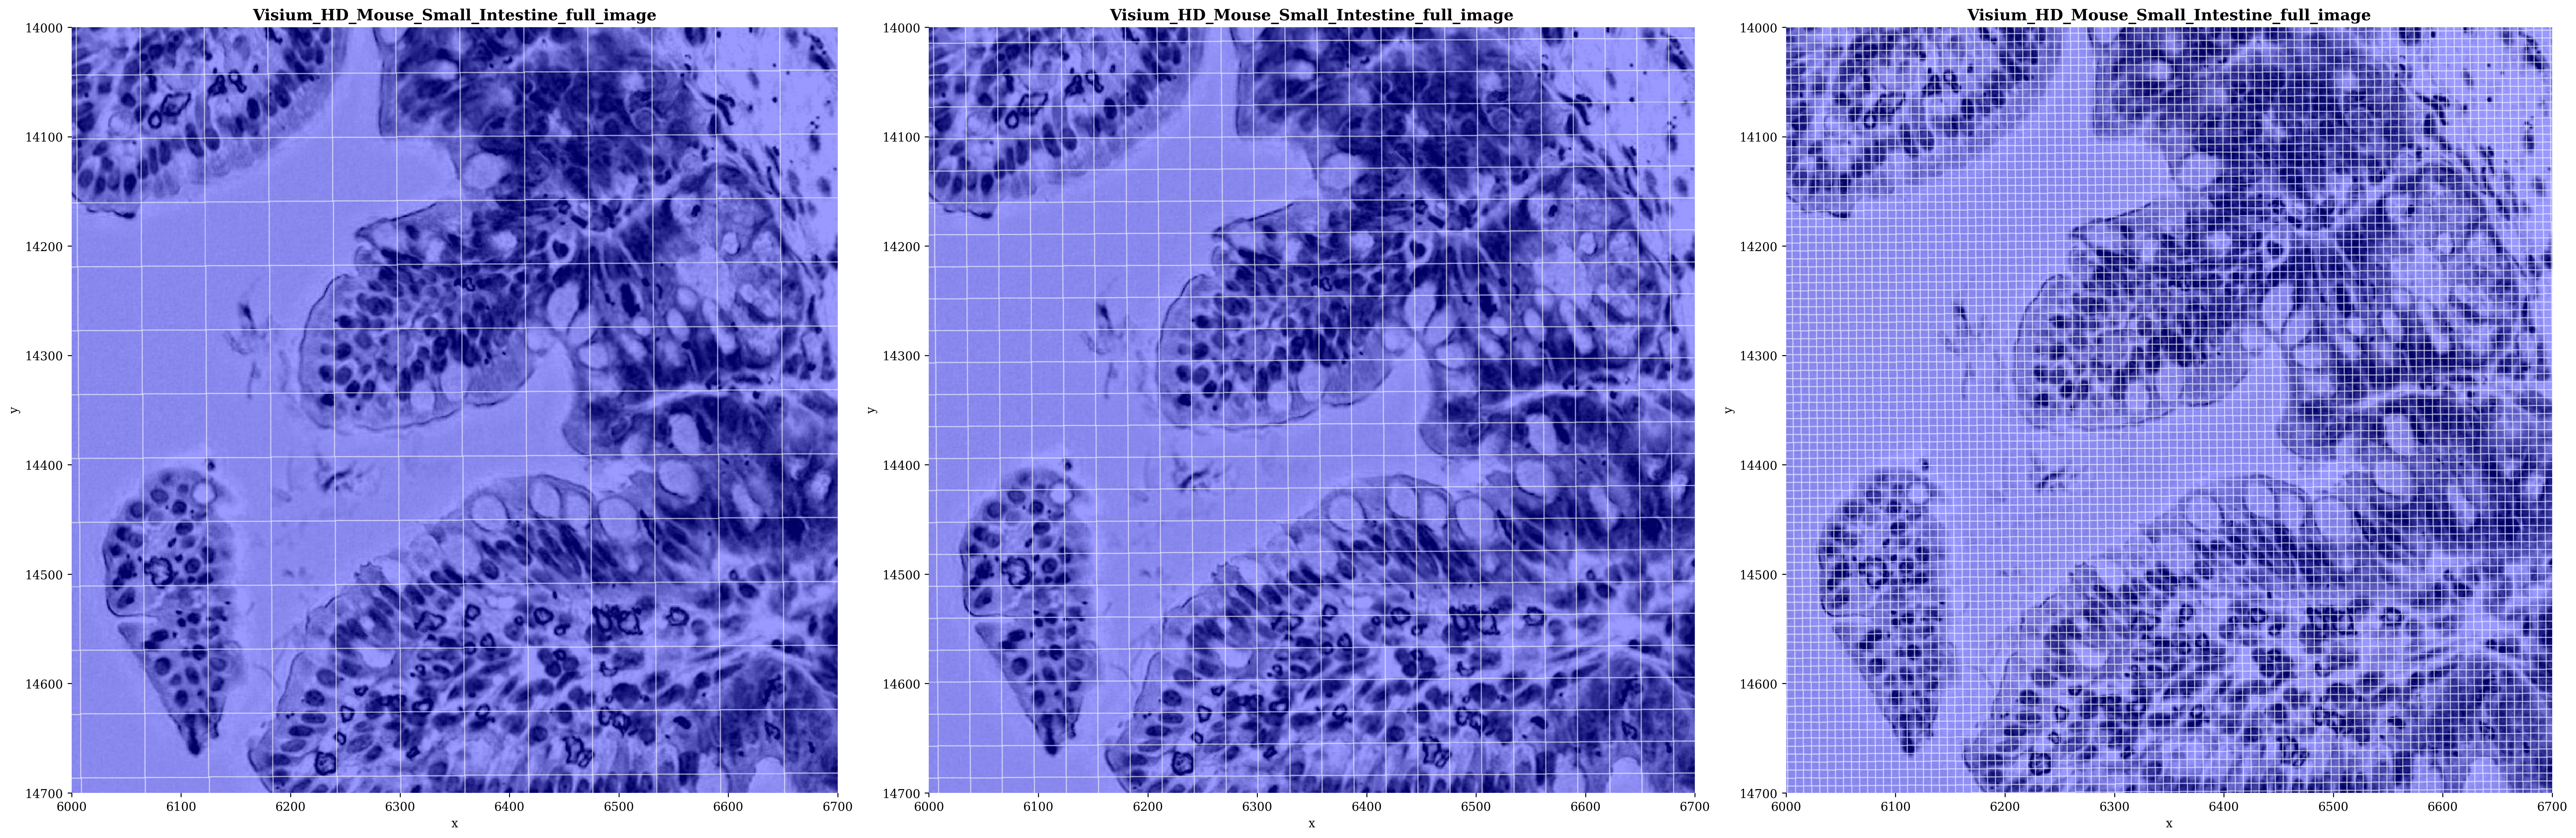
Let’s take a look at the original bins of our data. We can plot them in the default resolution 10x provides or at the 2µm, 8µm, or 16µm level. The counts in the 8 µm and 16 µm bins are computed by 10x as the sum of all 2 µm bins falling within each larger bin.
sp.pl.plot_shapes(sdata,
                  img_layer="Visium_HD_Mouse_Small_Intestine_full_image",
                  shapes_layer=["Visium_HD_Mouse_Small_Intestine_square_016um","Visium_HD_Mouse_Small_Intestine_square_008um","Visium_HD_Mouse_Small_Intestine_square_002um"],
                  crd = crd,
                  channel = "r",
                  alpha=0.4,
                  to_coordinate_system=COORDINATE_SYSTEM,
                  channel_title=False,
                  img_title=True
                  )
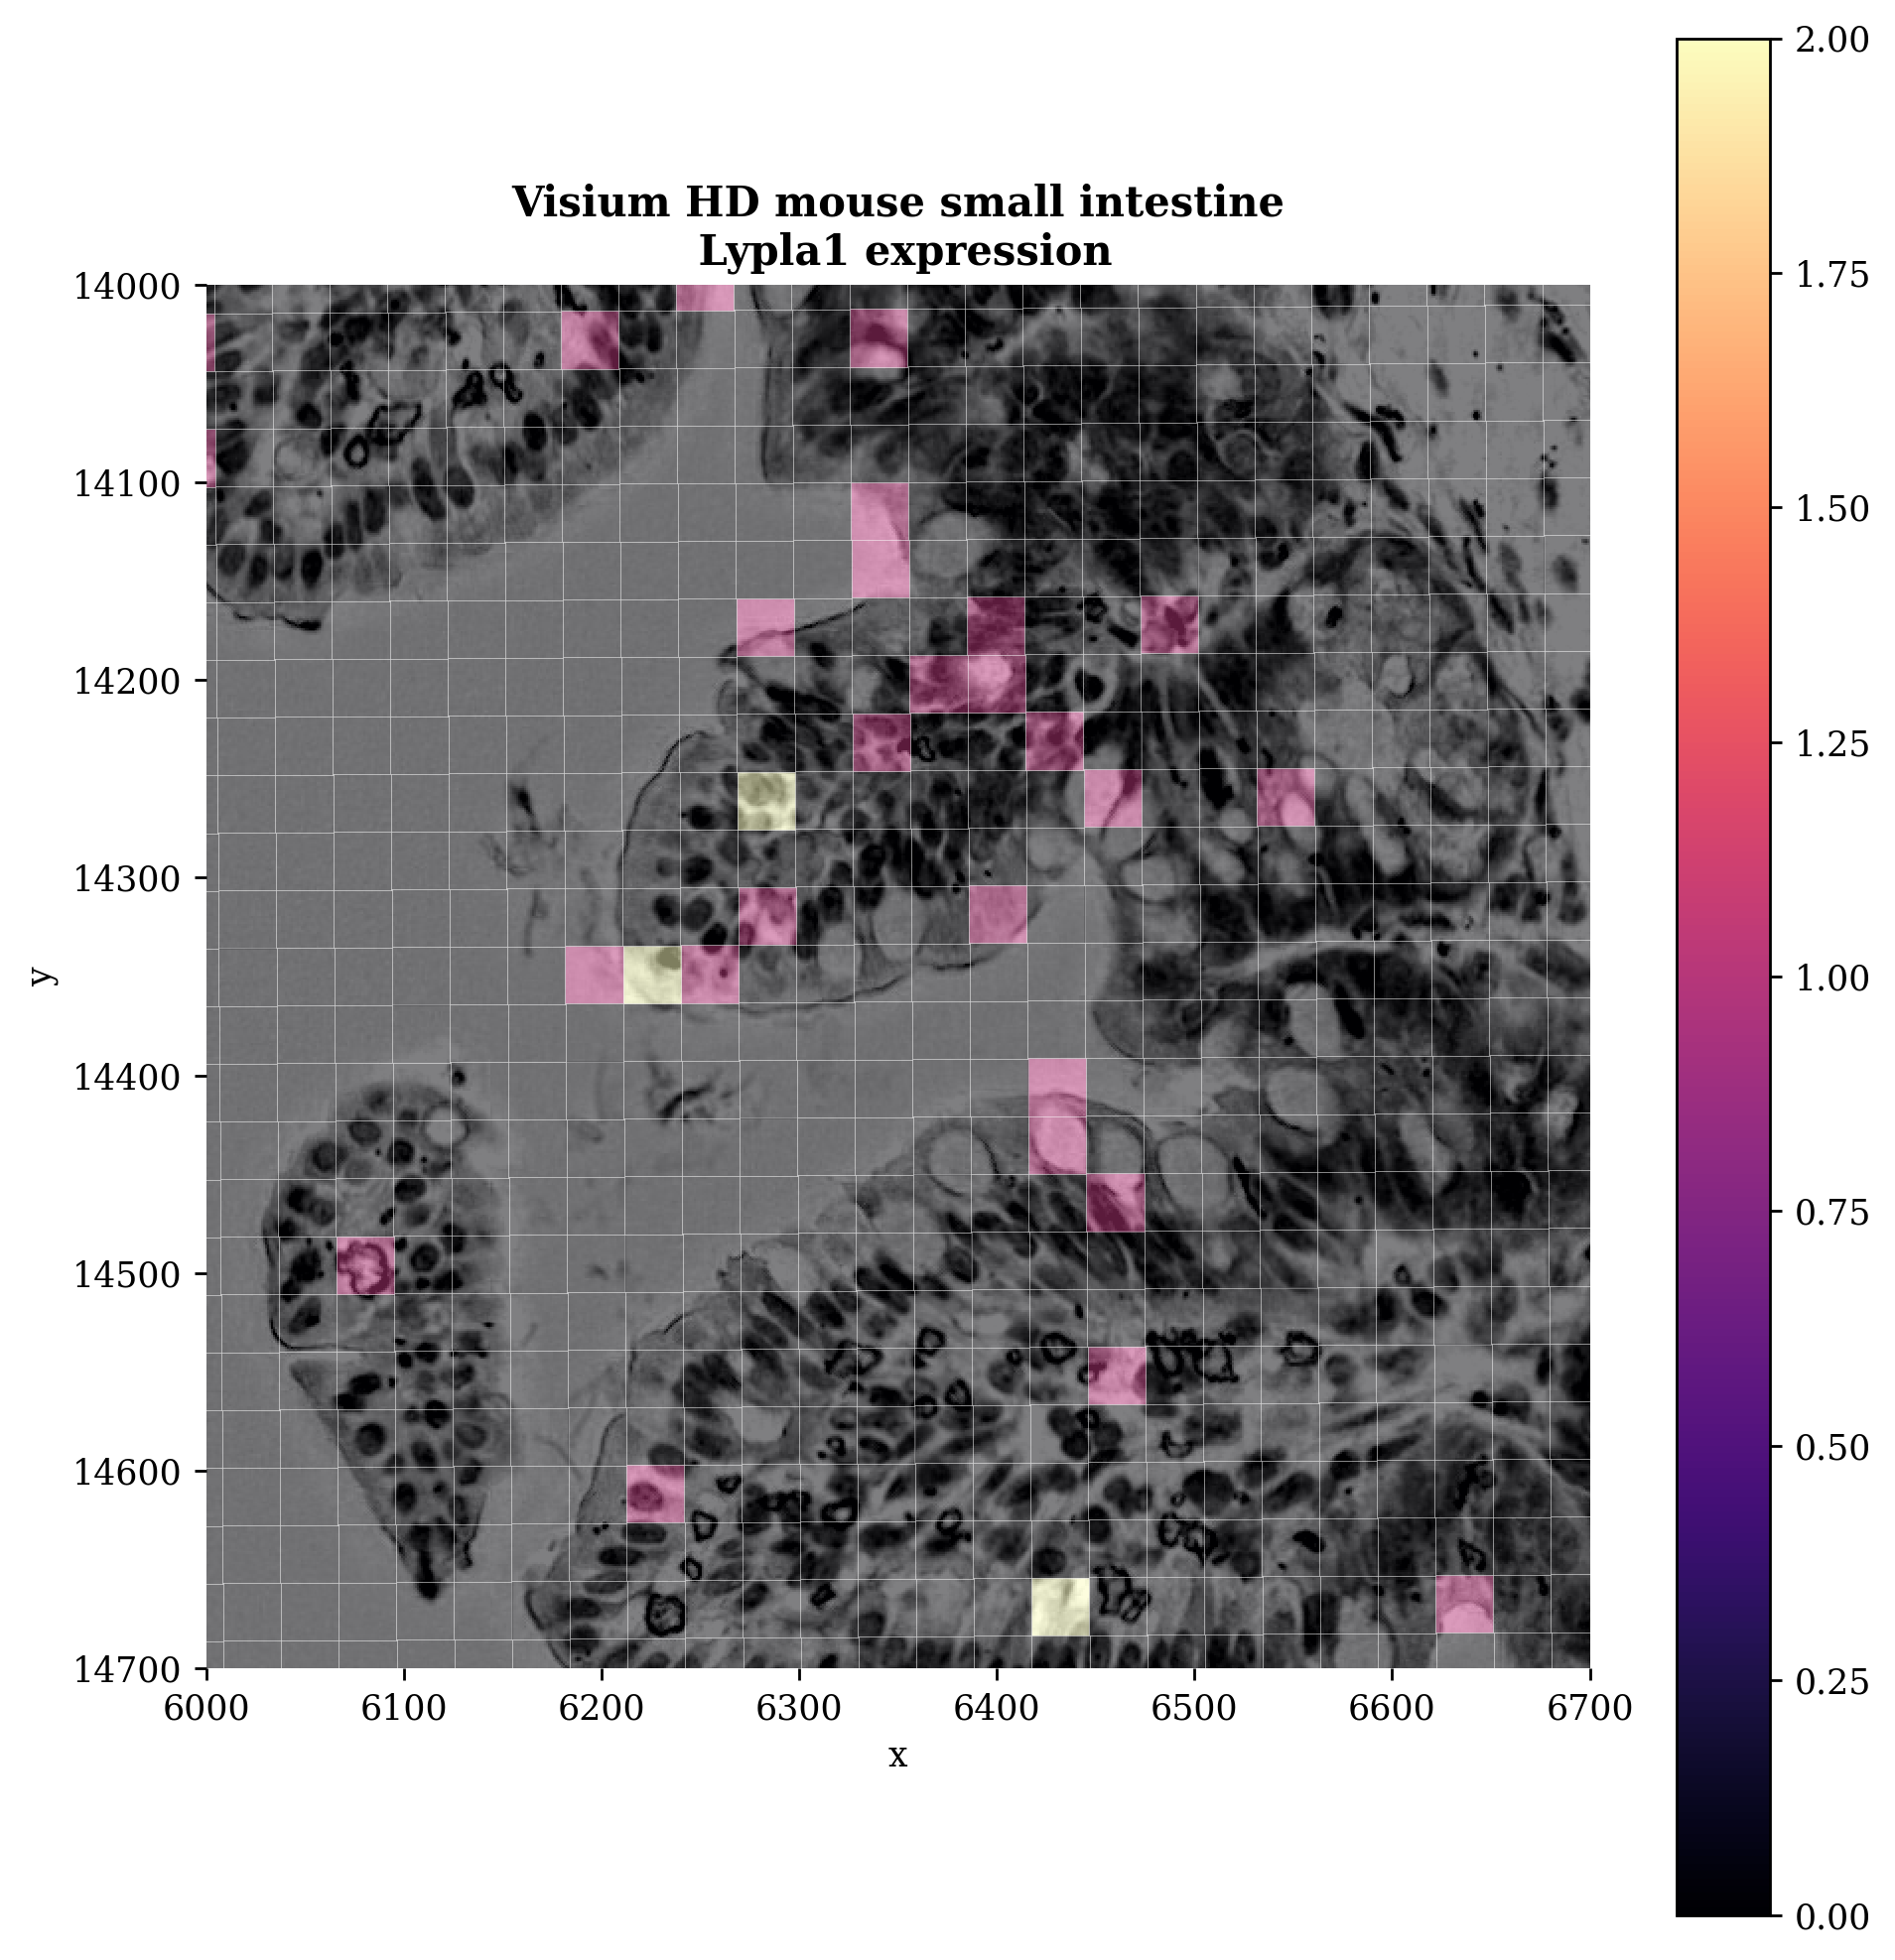
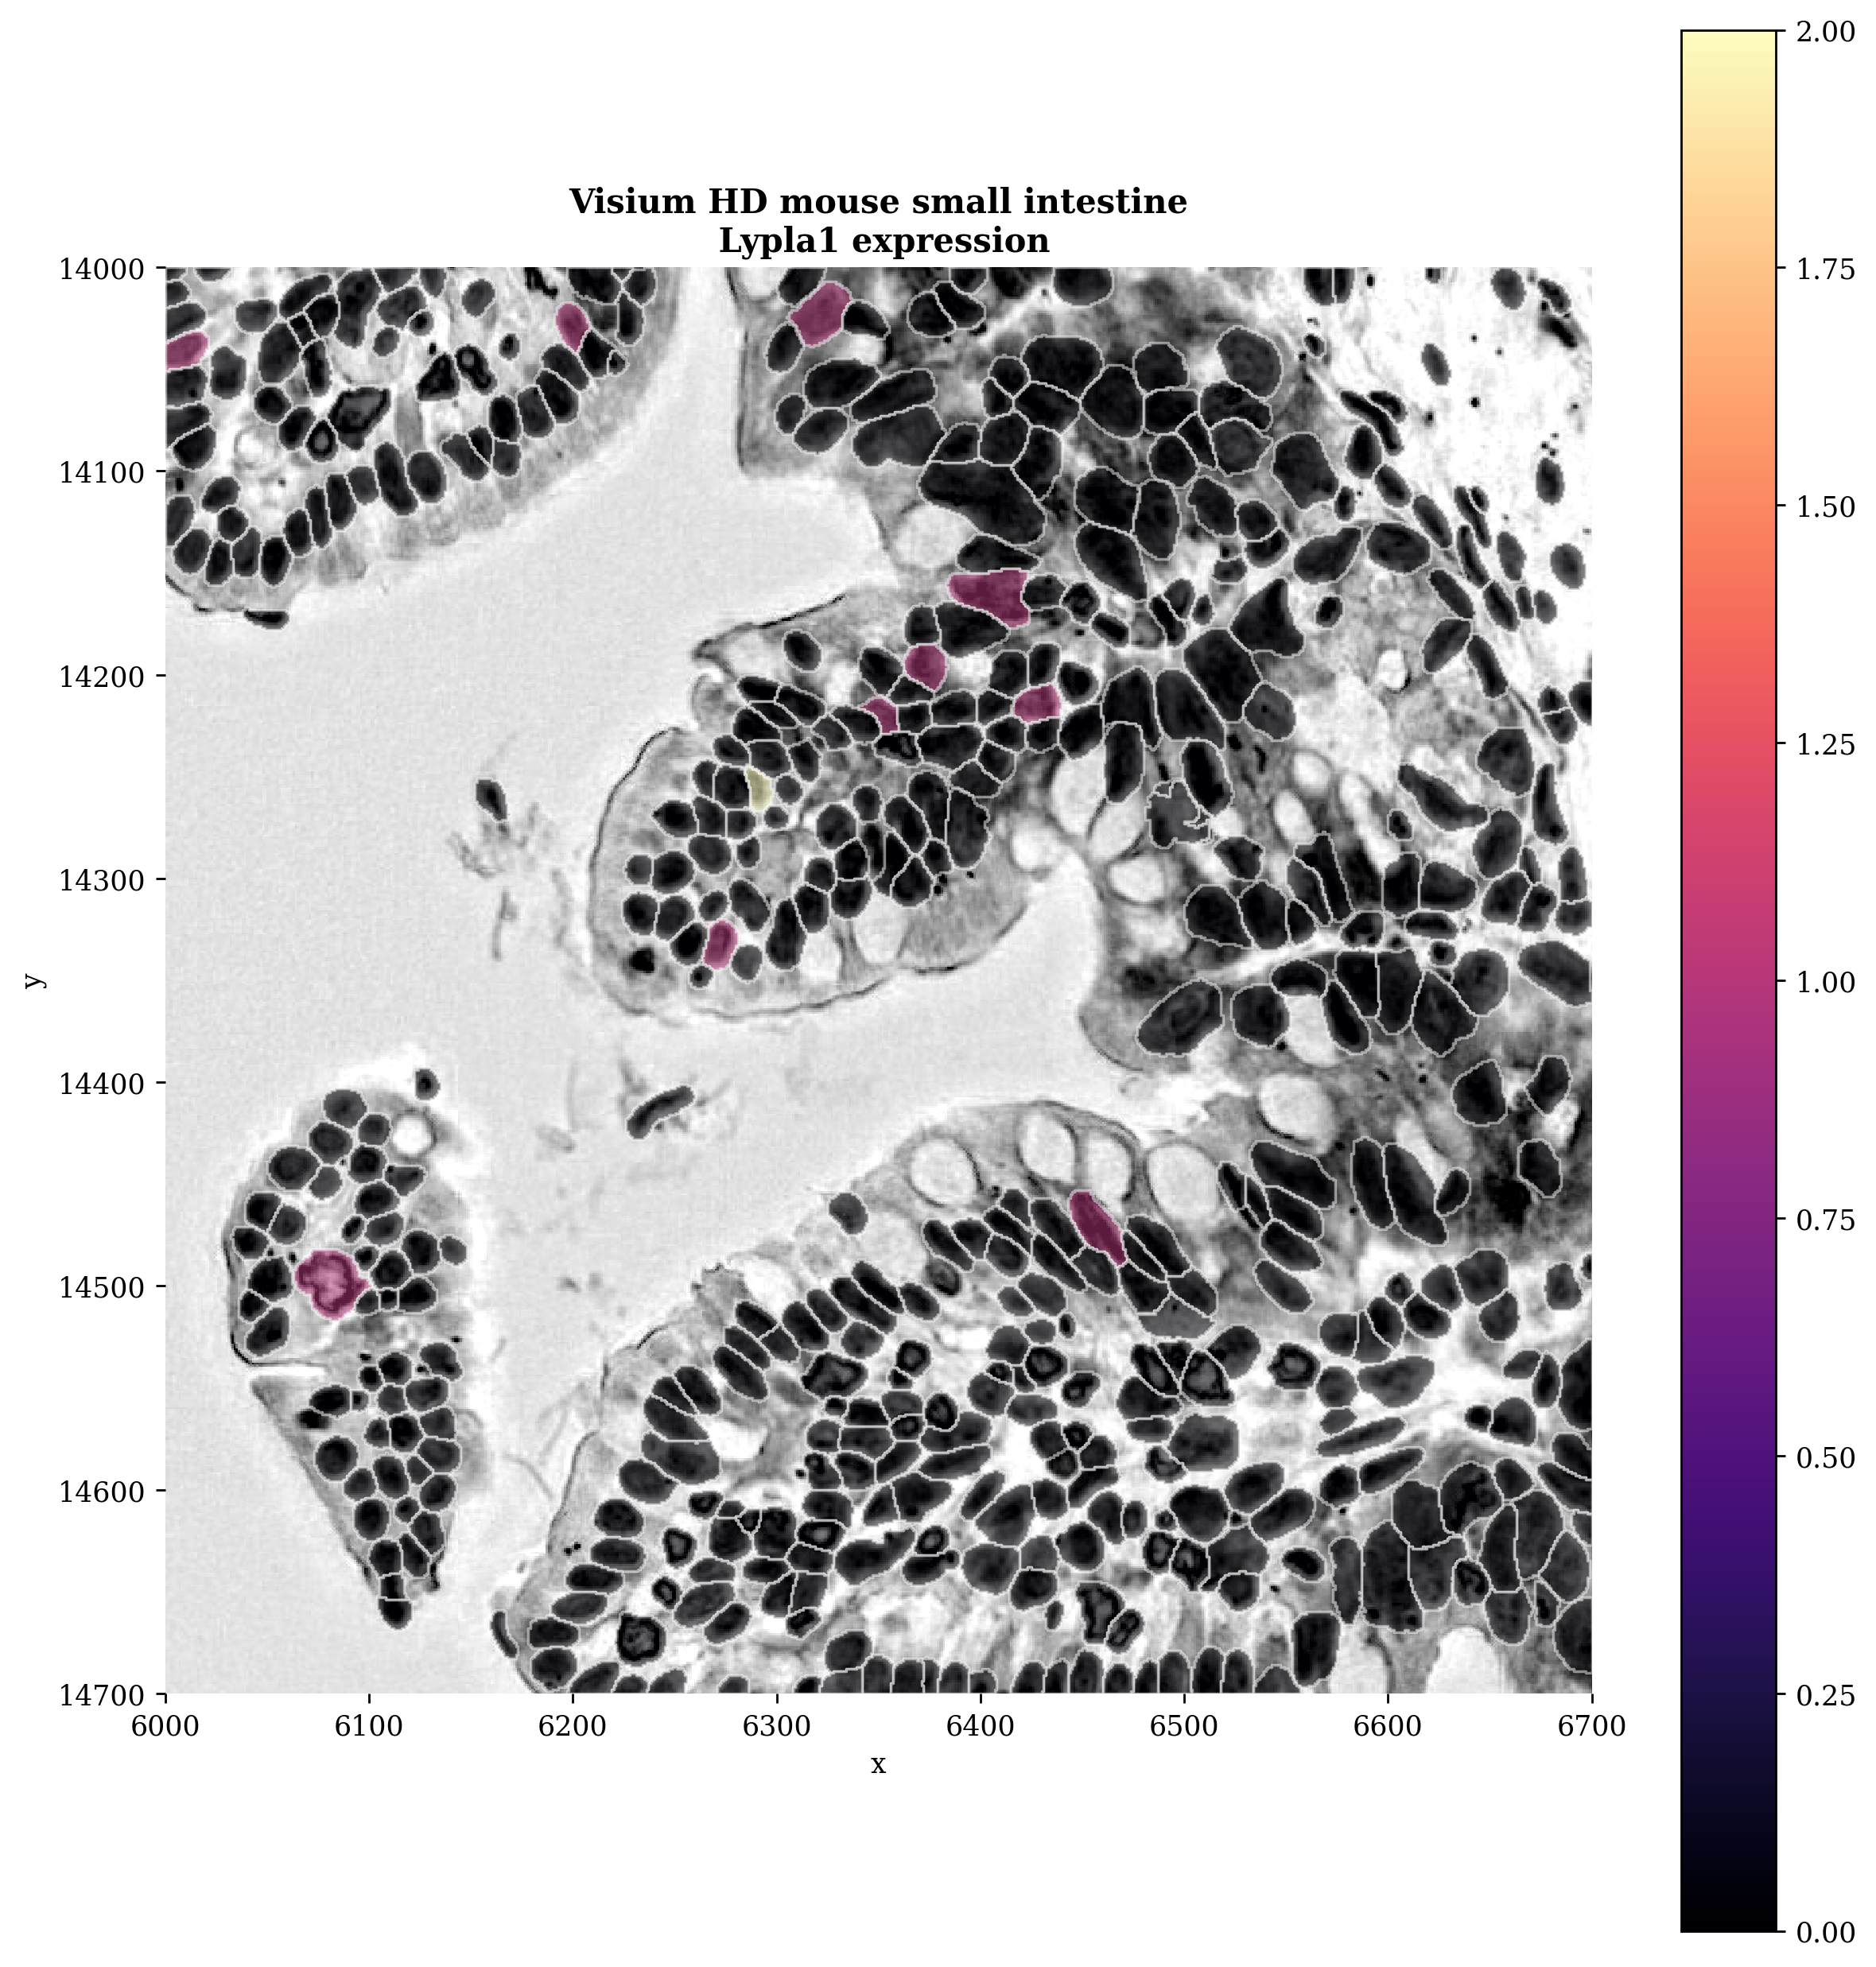
We can also plot specific genes. Below we will show the Lypla1 gene for example
# Gene to visualize
gene = "Lypla1"

fig, ax = plt.subplots(figsize=(8, 8), dpi=plot_dpi)

_plot(
    sdata=sdata,
    ax=ax,
    img_layer="Visium_HD_Mouse_Small_Intestine_full_image",
    shapes_layer="Visium_HD_Mouse_Small_Intestine_square_008um",
    crd=crd,
    channel="r",
    channel_title=False,
    img_title=False,
    table_layer = "square_008um",
    column=gene,
    linewidth=0.2,
    to_coordinate_system=COORDINATE_SYSTEM
    )

ax.set_title(f"Visium HD mouse small intestine\n {gene} expression", fontsize=12)
plt.tight_layout()
plt.show()
2. Segmenting the image#
Since Visium HD data is a sequencing-based spatial transcriptomics (ST) technology, the gene expression information is accessed in a grid of 2x2µm bins. 10X also provides the default aggregation of these bins into 8x8µm and 16x16µm. However, if we want to go to single-cell level, we can assign the 2x2µm bins to cells segmented from the provided high-resolution H&E image!
To generate custom nuclei-specific bins, we begin by segmenting the H&E image to create nuclei masks. Then we use the shape and location of each nucleus mask to sort barcodes into bins that correspond to each individual nucleus. Lastly, we perform gene-wise summation of UMI counts in each bin, resulting in a gene-by-binned barcode matrix. (source: https://www.10xgenomics.com/analysis-guides/segmentation-visium-hd#overview)
2.1 Using a provided segmentation mask#
For this dataset, 10X has provided a tutorial to segment the nuclei and a custom binning approach which we will adopt here as well. Feel free to read it yourself here. We can read in these pre-made segmentation masks from the registry.
A few important details about loading the segmentation masks:
Index starting at 1: The index is shifted to start at 1 (rather than 0) because below index 0 is reserved for the background in the rasterized labels representation. Each polygon’s index must match the integer label it will receive in the raster mask.
sp.sh.add_shapes_layer: Registers the GeoDataFrame as a named shapes layer inside theSpatialDataobject and writes it to the Zarr store.set_transformation(..., Identity()): Associates the shapes with theVisium_HD_Mouse_Small_Intestinecoordinate system using an identity transformation, meaning the polygon coordinates are already in the same pixel space as the full-resolution H&E image — no scaling or translation is needed.
# custom segmentation of H&E
path_polygons = registry.fetch("transcriptomics/visium_hd/mouse/masks.geojson")
gdf = gpd.read_file(path_polygons)

# Make sure the index starts at 1, so that it matches with the segmentation mask
gdf.index += 1
sp.sh.add_shapes_layer(
    sdata,
    input=gdf,
    output_layer="10X_segmentation_boundaries",
    overwrite=True,
    )

# Add the shapes to the Visium HD coordinate system.
set_transformation(
    element=sdata['10X_segmentation_boundaries'],
    transformation=Identity(),
    to_coordinate_system=COORDINATE_SYSTEM,
    write_to_sdata=sdata
    )

sdata
SpatialData object, with associated Zarr store: C:\Users\stijnb\AppData\Local\Temp\sdata_20260610_114301.zarr
├── Images
│     ├── 'Visium_HD_Mouse_Small_Intestine_full_image': DataTree[cyx] (3, 21943, 23618), (3, 10971, 11809), (3, 5485, 5904), (3, 2742, 2952), (3, 1371, 1476)
│     ├── 'Visium_HD_Mouse_Small_Intestine_hires_image': DataArray[cyx] (3, 5575, 6000)
│     └── 'Visium_HD_Mouse_Small_Intestine_lowres_image': DataArray[cyx] (3, 558, 600)
├── Labels
│     ├── 'Visium_HD_Mouse_Small_Intestine_square_002um_labels': DataArray[yx] (3285, 3191)
│     ├── 'Visium_HD_Mouse_Small_Intestine_square_008um_labels': DataArray[yx] (822, 799)
│     └── 'Visium_HD_Mouse_Small_Intestine_square_016um_labels': DataArray[yx] (412, 400)
├── Shapes
│     ├── '10X_segmentation_boundaries': GeoDataFrame shape: (369006, 2) (2D shapes)
│     ├── 'Visium_HD_Mouse_Small_Intestine_square_002um': GeoDataFrame shape: (5479660, 1) (2D shapes)
│     ├── 'Visium_HD_Mouse_Small_Intestine_square_008um': GeoDataFrame shape: (351817, 1) (2D shapes)
│     └── 'Visium_HD_Mouse_Small_Intestine_square_016um': GeoDataFrame shape: (91033, 1) (2D shapes)
└── Tables
      ├── 'square_002um': AnnData (5479660, 19059)
      ├── 'square_008um': AnnData (351817, 19059)
      └── 'square_016um': AnnData (91033, 19059)
with coordinate systems:
    ▸ 'Visium_HD_Mouse_Small_Intestine', with elements:
        Visium_HD_Mouse_Small_Intestine_full_image (Images), Visium_HD_Mouse_Small_Intestine_hires_image (Images), Visium_HD_Mouse_Small_Intestine_lowres_image (Images), Visium_HD_Mouse_Small_Intestine_square_002um_labels (Labels), Visium_HD_Mouse_Small_Intestine_square_008um_labels (Labels), Visium_HD_Mouse_Small_Intestine_square_016um_labels (Labels), 10X_segmentation_boundaries (Shapes), Visium_HD_Mouse_Small_Intestine_square_002um (Shapes), Visium_HD_Mouse_Small_Intestine_square_008um (Shapes), Visium_HD_Mouse_Small_Intestine_square_016um (Shapes)
    ▸ 'Visium_HD_Mouse_Small_Intestine_downscaled_hires', with elements:
        Visium_HD_Mouse_Small_Intestine_hires_image (Images), Visium_HD_Mouse_Small_Intestine_square_002um_labels (Labels), Visium_HD_Mouse_Small_Intestine_square_008um_labels (Labels), Visium_HD_Mouse_Small_Intestine_square_016um_labels (Labels), Visium_HD_Mouse_Small_Intestine_square_002um (Shapes), Visium_HD_Mouse_Small_Intestine_square_008um (Shapes), Visium_HD_Mouse_Small_Intestine_square_016um (Shapes)
    ▸ 'Visium_HD_Mouse_Small_Intestine_downscaled_lowres', with elements:
        Visium_HD_Mouse_Small_Intestine_lowres_image (Images), Visium_HD_Mouse_Small_Intestine_square_002um_labels (Labels), Visium_HD_Mouse_Small_Intestine_square_008um_labels (Labels), Visium_HD_Mouse_Small_Intestine_square_016um_labels (Labels), Visium_HD_Mouse_Small_Intestine_square_002um (Shapes), Visium_HD_Mouse_Small_Intestine_square_008um (Shapes), Visium_HD_Mouse_Small_Intestine_square_016um (Shapes)
    ▸ 'global', with elements:
        10X_segmentation_boundaries (Shapes)
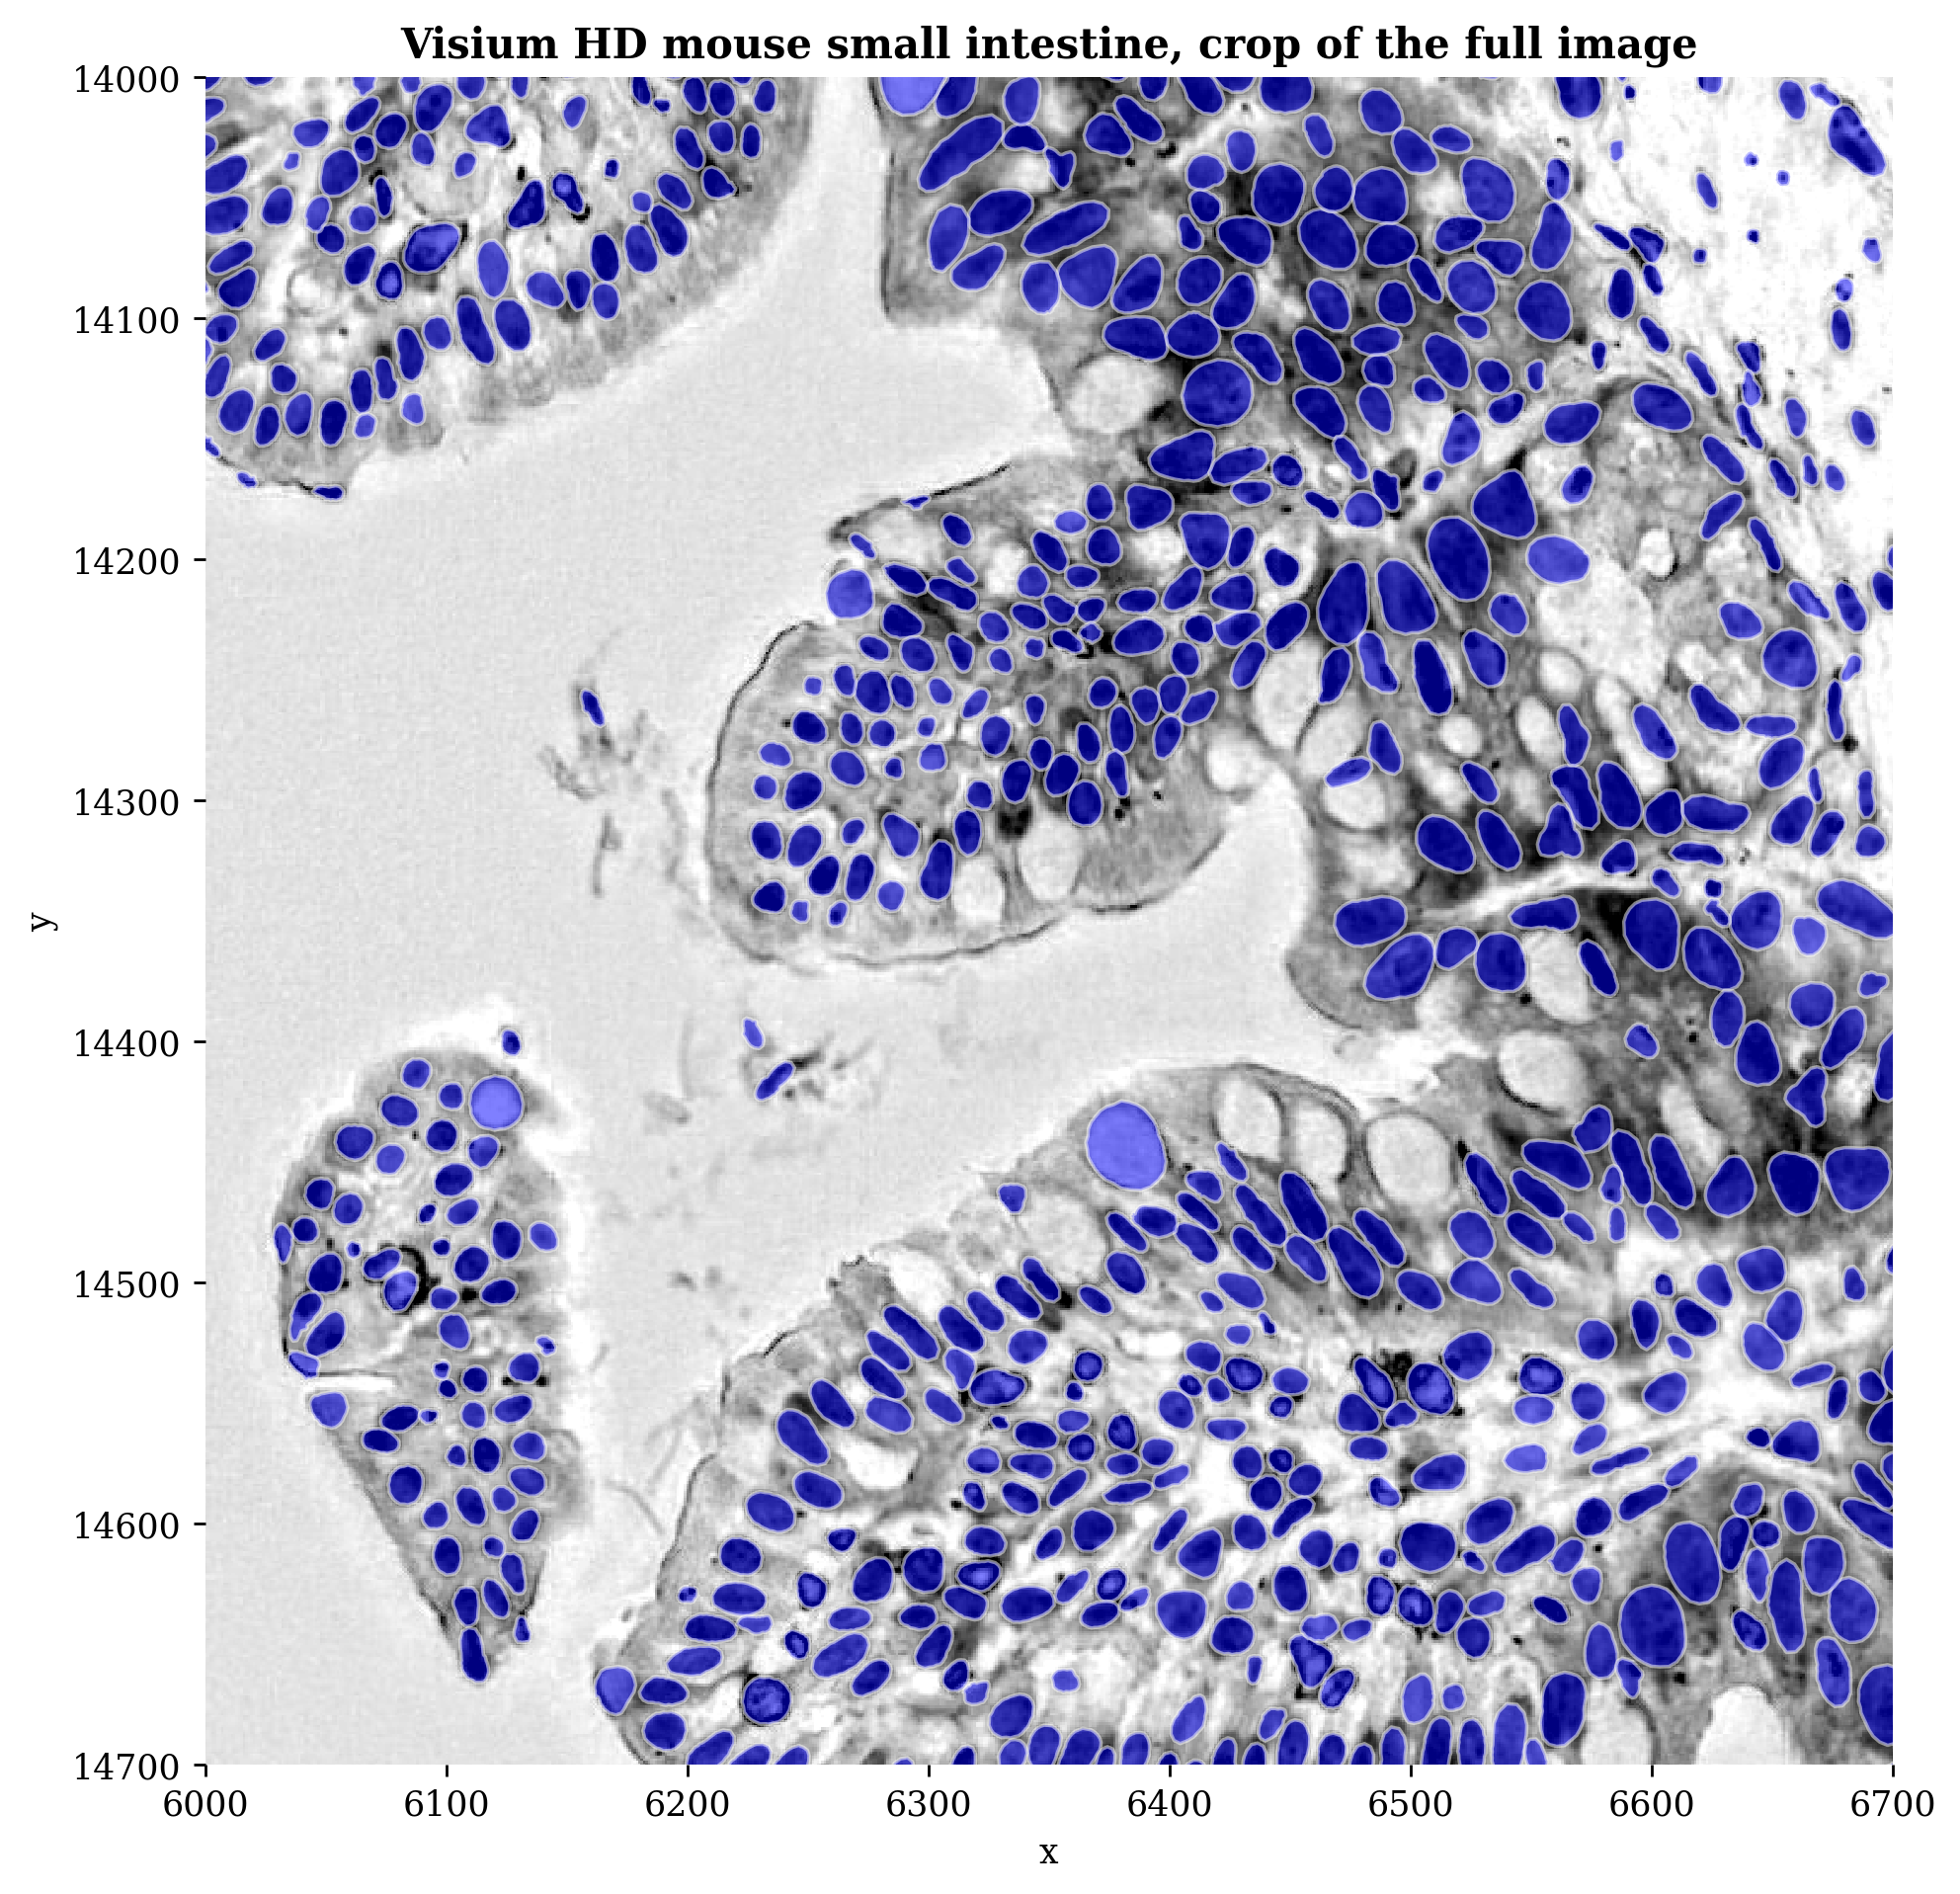
fig, ax = plt.subplots(figsize=(8, 8), dpi=plot_dpi)

_plot(
    sdata,
    ax,
    img_layer="Visium_HD_Mouse_Small_Intestine_full_image",
    shapes_layer="10X_segmentation_boundaries",
    crd =crd,
    channel="r",
    to_coordinate_system=COORDINATE_SYSTEM,
    channel_title=False,
    img_title=False
    )
ax.set_title("Visium HD mouse small intestine, crop of the full image", fontsize=12)
plt.tight_layout()
plt.show()
Rasterization#
The shapes layer stores nuclei as vector polygons, but sp.tb.bin_counts works with a labels layers. These are raster (pixel) arrays where each pixel holds the integer ID of the nucleus it belongs to (with 0 being the background). sp.im.rasterize converts the polygon boundaries into this integer mask, matching the resolution and extent of the full-resolution H&E image.
# rasterize shapes layer into a labels layer
labels_layer = "10X_segmentation_mask"

sp.im.rasterize(sdata,
                shapes_layer="10X_segmentation_boundaries",
                output_layer=labels_layer,
                overwrite=True)

set_transformation(element=sdata['10X_segmentation_mask'],
                   transformation=Identity(),
                   to_coordinate_system=COORDINATE_SYSTEM,
                   write_to_sdata=sdata)
sp.tb.bin_counts is the core aggregation step. It overlaps the 2 µm expression bins (square_002um table) with the rasterized nucleus mask and sums the UMI counts of all bins that fall inside each nucleus. The result is a new gene-by-cell count matrix, effectively giving single-cell resolution gene expression profiles derived from the Visium HD bins.
# bin barcodes to the segmentation masks
sp.tb.bin_counts(
    sdata,
    table_layer="square_002um",
    labels_layer="10X_segmentation_mask",
    output_layer="10X_custom_binning",
    to_coordinate_system=COORDINATE_SYSTEM,
    append = False,
    overwrite=True,
    )
SpatialData object, with associated Zarr store: C:\Users\stijnb\AppData\Local\Temp\sdata_20260610_114301.zarr
├── Images
│     ├── 'Visium_HD_Mouse_Small_Intestine_full_image': DataTree[cyx] (3, 21943, 23618), (3, 10971, 11809), (3, 5485, 5904), (3, 2742, 2952), (3, 1371, 1476)
│     ├── 'Visium_HD_Mouse_Small_Intestine_hires_image': DataArray[cyx] (3, 5575, 6000)
│     └── 'Visium_HD_Mouse_Small_Intestine_lowres_image': DataArray[cyx] (3, 558, 600)
├── Labels
│     ├── '10X_segmentation_mask': DataArray[yx] (21702, 23331)
│     ├── 'Visium_HD_Mouse_Small_Intestine_square_002um_labels': DataArray[yx] (3285, 3191)
│     ├── 'Visium_HD_Mouse_Small_Intestine_square_008um_labels': DataArray[yx] (822, 799)
│     └── 'Visium_HD_Mouse_Small_Intestine_square_016um_labels': DataArray[yx] (412, 400)
├── Shapes
│     ├── '10X_segmentation_boundaries': GeoDataFrame shape: (369006, 2) (2D shapes)
│     ├── 'Visium_HD_Mouse_Small_Intestine_square_002um': GeoDataFrame shape: (5479660, 1) (2D shapes)
│     ├── 'Visium_HD_Mouse_Small_Intestine_square_008um': GeoDataFrame shape: (351817, 1) (2D shapes)
│     └── 'Visium_HD_Mouse_Small_Intestine_square_016um': GeoDataFrame shape: (91033, 1) (2D shapes)
└── Tables
      ├── '10X_custom_binning': AnnData (359782, 19059)
      ├── 'square_002um': AnnData (5479660, 19059)
      ├── 'square_008um': AnnData (351817, 19059)
      └── 'square_016um': AnnData (91033, 19059)
with coordinate systems:
    ▸ 'Visium_HD_Mouse_Small_Intestine', with elements:
        Visium_HD_Mouse_Small_Intestine_full_image (Images), Visium_HD_Mouse_Small_Intestine_hires_image (Images), Visium_HD_Mouse_Small_Intestine_lowres_image (Images), 10X_segmentation_mask (Labels), Visium_HD_Mouse_Small_Intestine_square_002um_labels (Labels), Visium_HD_Mouse_Small_Intestine_square_008um_labels (Labels), Visium_HD_Mouse_Small_Intestine_square_016um_labels (Labels), 10X_segmentation_boundaries (Shapes), Visium_HD_Mouse_Small_Intestine_square_002um (Shapes), Visium_HD_Mouse_Small_Intestine_square_008um (Shapes), Visium_HD_Mouse_Small_Intestine_square_016um (Shapes)
    ▸ 'Visium_HD_Mouse_Small_Intestine_downscaled_hires', with elements:
        Visium_HD_Mouse_Small_Intestine_hires_image (Images), Visium_HD_Mouse_Small_Intestine_square_002um_labels (Labels), Visium_HD_Mouse_Small_Intestine_square_008um_labels (Labels), Visium_HD_Mouse_Small_Intestine_square_016um_labels (Labels), Visium_HD_Mouse_Small_Intestine_square_002um (Shapes), Visium_HD_Mouse_Small_Intestine_square_008um (Shapes), Visium_HD_Mouse_Small_Intestine_square_016um (Shapes)
    ▸ 'Visium_HD_Mouse_Small_Intestine_downscaled_lowres', with elements:
        Visium_HD_Mouse_Small_Intestine_lowres_image (Images), Visium_HD_Mouse_Small_Intestine_square_002um_labels (Labels), Visium_HD_Mouse_Small_Intestine_square_008um_labels (Labels), Visium_HD_Mouse_Small_Intestine_square_016um_labels (Labels), Visium_HD_Mouse_Small_Intestine_square_002um (Shapes), Visium_HD_Mouse_Small_Intestine_square_008um (Shapes), Visium_HD_Mouse_Small_Intestine_square_016um (Shapes)
    ▸ 'global', with elements:
        10X_segmentation_mask (Labels), 10X_segmentation_boundaries (Shapes)
# now we can plot genes onto the individual cells
fig, ax = plt.subplots(figsize=(10, 10), dpi=plot_dpi)

_plot(
    sdata,
    ax,
    img_layer = "Visium_HD_Mouse_Small_Intestine_full_image",
    shapes_layer="10X_segmentation_boundaries", # shapes layer corresponding to labels layer
    crd=crd,
    to_coordinate_system=COORDINATE_SYSTEM,
    channel="r",
    table_layer = "10X_custom_binning",
    column=gene,
)

ax.set_title(f"Visium HD mouse small intestine\n {gene} expression", fontsize=12)
plt.tight_layout()
plt.show()

We now have a genes-by-cells table, we can now do further processing steps (normalization, clustering, etc.) on this. These are covered in the general tutorial here.
2.2 Segmenting the image yourself#
Instead of using segmentation masks provided by 10X, you can also try and segment the H&E image of your Visium HD data yourself. Several segmentation approaches and models are available for this purpose. In this tutorial, we will be using the nuclei model of Cellpose. Although this model is not specifically trained on H&E images, we found that inverting the red channel of the image yields good segmentation performance.
# add inversed red channel to sdata object
img = sdata["Visium_HD_Mouse_Small_Intestine_full_image"].scale0.image
img = img[0:1, :, :]
# Invert the image by subtracting pixel values from 255 (assuming 8-bit images!)
img_inv = 255 - img

# Add the inverted image as a new layer to the sdata object
sdata = sp.im.add_image_layer(
    sdata,
    arr=img_inv.data,
    output_layer="crop_inv",
    dims=("c", "y", "x"),
    overwrite=True,
)

set_transformation(
    element=sdata["crop_inv"],
    transformation=Identity(),
    to_coordinate_system=COORDINATE_SYSTEM,
    write_to_sdata=sdata,
)

sdata
SpatialData object, with associated Zarr store: C:\Users\stijnb\AppData\Local\Temp\sdata_20260610_114301.zarr
├── Images
│     ├── 'Visium_HD_Mouse_Small_Intestine_full_image': DataTree[cyx] (3, 21943, 23618), (3, 10971, 11809), (3, 5485, 5904), (3, 2742, 2952), (3, 1371, 1476)
│     ├── 'Visium_HD_Mouse_Small_Intestine_hires_image': DataArray[cyx] (3, 5575, 6000)
│     ├── 'Visium_HD_Mouse_Small_Intestine_lowres_image': DataArray[cyx] (3, 558, 600)
│     └── 'crop_inv': DataArray[cyx] (1, 21943, 23618)
├── Labels
│     ├── '10X_segmentation_mask': DataArray[yx] (21702, 23331)
│     ├── 'Visium_HD_Mouse_Small_Intestine_square_002um_labels': DataArray[yx] (3285, 3191)
│     ├── 'Visium_HD_Mouse_Small_Intestine_square_008um_labels': DataArray[yx] (822, 799)
│     └── 'Visium_HD_Mouse_Small_Intestine_square_016um_labels': DataArray[yx] (412, 400)
├── Shapes
│     ├── '10X_segmentation_boundaries': GeoDataFrame shape: (369006, 2) (2D shapes)
│     ├── 'Visium_HD_Mouse_Small_Intestine_square_002um': GeoDataFrame shape: (5479660, 1) (2D shapes)
│     ├── 'Visium_HD_Mouse_Small_Intestine_square_008um': GeoDataFrame shape: (351817, 1) (2D shapes)
│     └── 'Visium_HD_Mouse_Small_Intestine_square_016um': GeoDataFrame shape: (91033, 1) (2D shapes)
└── Tables
      ├── '10X_custom_binning': AnnData (359782, 19059)
      ├── 'square_002um': AnnData (5479660, 19059)
      ├── 'square_008um': AnnData (351817, 19059)
      └── 'square_016um': AnnData (91033, 19059)
with coordinate systems:
    ▸ 'Visium_HD_Mouse_Small_Intestine', with elements:
        Visium_HD_Mouse_Small_Intestine_full_image (Images), Visium_HD_Mouse_Small_Intestine_hires_image (Images), Visium_HD_Mouse_Small_Intestine_lowres_image (Images), crop_inv (Images), 10X_segmentation_mask (Labels), Visium_HD_Mouse_Small_Intestine_square_002um_labels (Labels), Visium_HD_Mouse_Small_Intestine_square_008um_labels (Labels), Visium_HD_Mouse_Small_Intestine_square_016um_labels (Labels), 10X_segmentation_boundaries (Shapes), Visium_HD_Mouse_Small_Intestine_square_002um (Shapes), Visium_HD_Mouse_Small_Intestine_square_008um (Shapes), Visium_HD_Mouse_Small_Intestine_square_016um (Shapes)
    ▸ 'Visium_HD_Mouse_Small_Intestine_downscaled_hires', with elements:
        Visium_HD_Mouse_Small_Intestine_hires_image (Images), Visium_HD_Mouse_Small_Intestine_square_002um_labels (Labels), Visium_HD_Mouse_Small_Intestine_square_008um_labels (Labels), Visium_HD_Mouse_Small_Intestine_square_016um_labels (Labels), Visium_HD_Mouse_Small_Intestine_square_002um (Shapes), Visium_HD_Mouse_Small_Intestine_square_008um (Shapes), Visium_HD_Mouse_Small_Intestine_square_016um (Shapes)
    ▸ 'Visium_HD_Mouse_Small_Intestine_downscaled_lowres', with elements:
        Visium_HD_Mouse_Small_Intestine_lowres_image (Images), Visium_HD_Mouse_Small_Intestine_square_002um_labels (Labels), Visium_HD_Mouse_Small_Intestine_square_008um_labels (Labels), Visium_HD_Mouse_Small_Intestine_square_016um_labels (Labels), Visium_HD_Mouse_Small_Intestine_square_002um (Shapes), Visium_HD_Mouse_Small_Intestine_square_008um (Shapes), Visium_HD_Mouse_Small_Intestine_square_016um (Shapes)
    ▸ 'global', with elements:
        crop_inv (Images), 10X_segmentation_mask (Labels), 10X_segmentation_boundaries (Shapes)
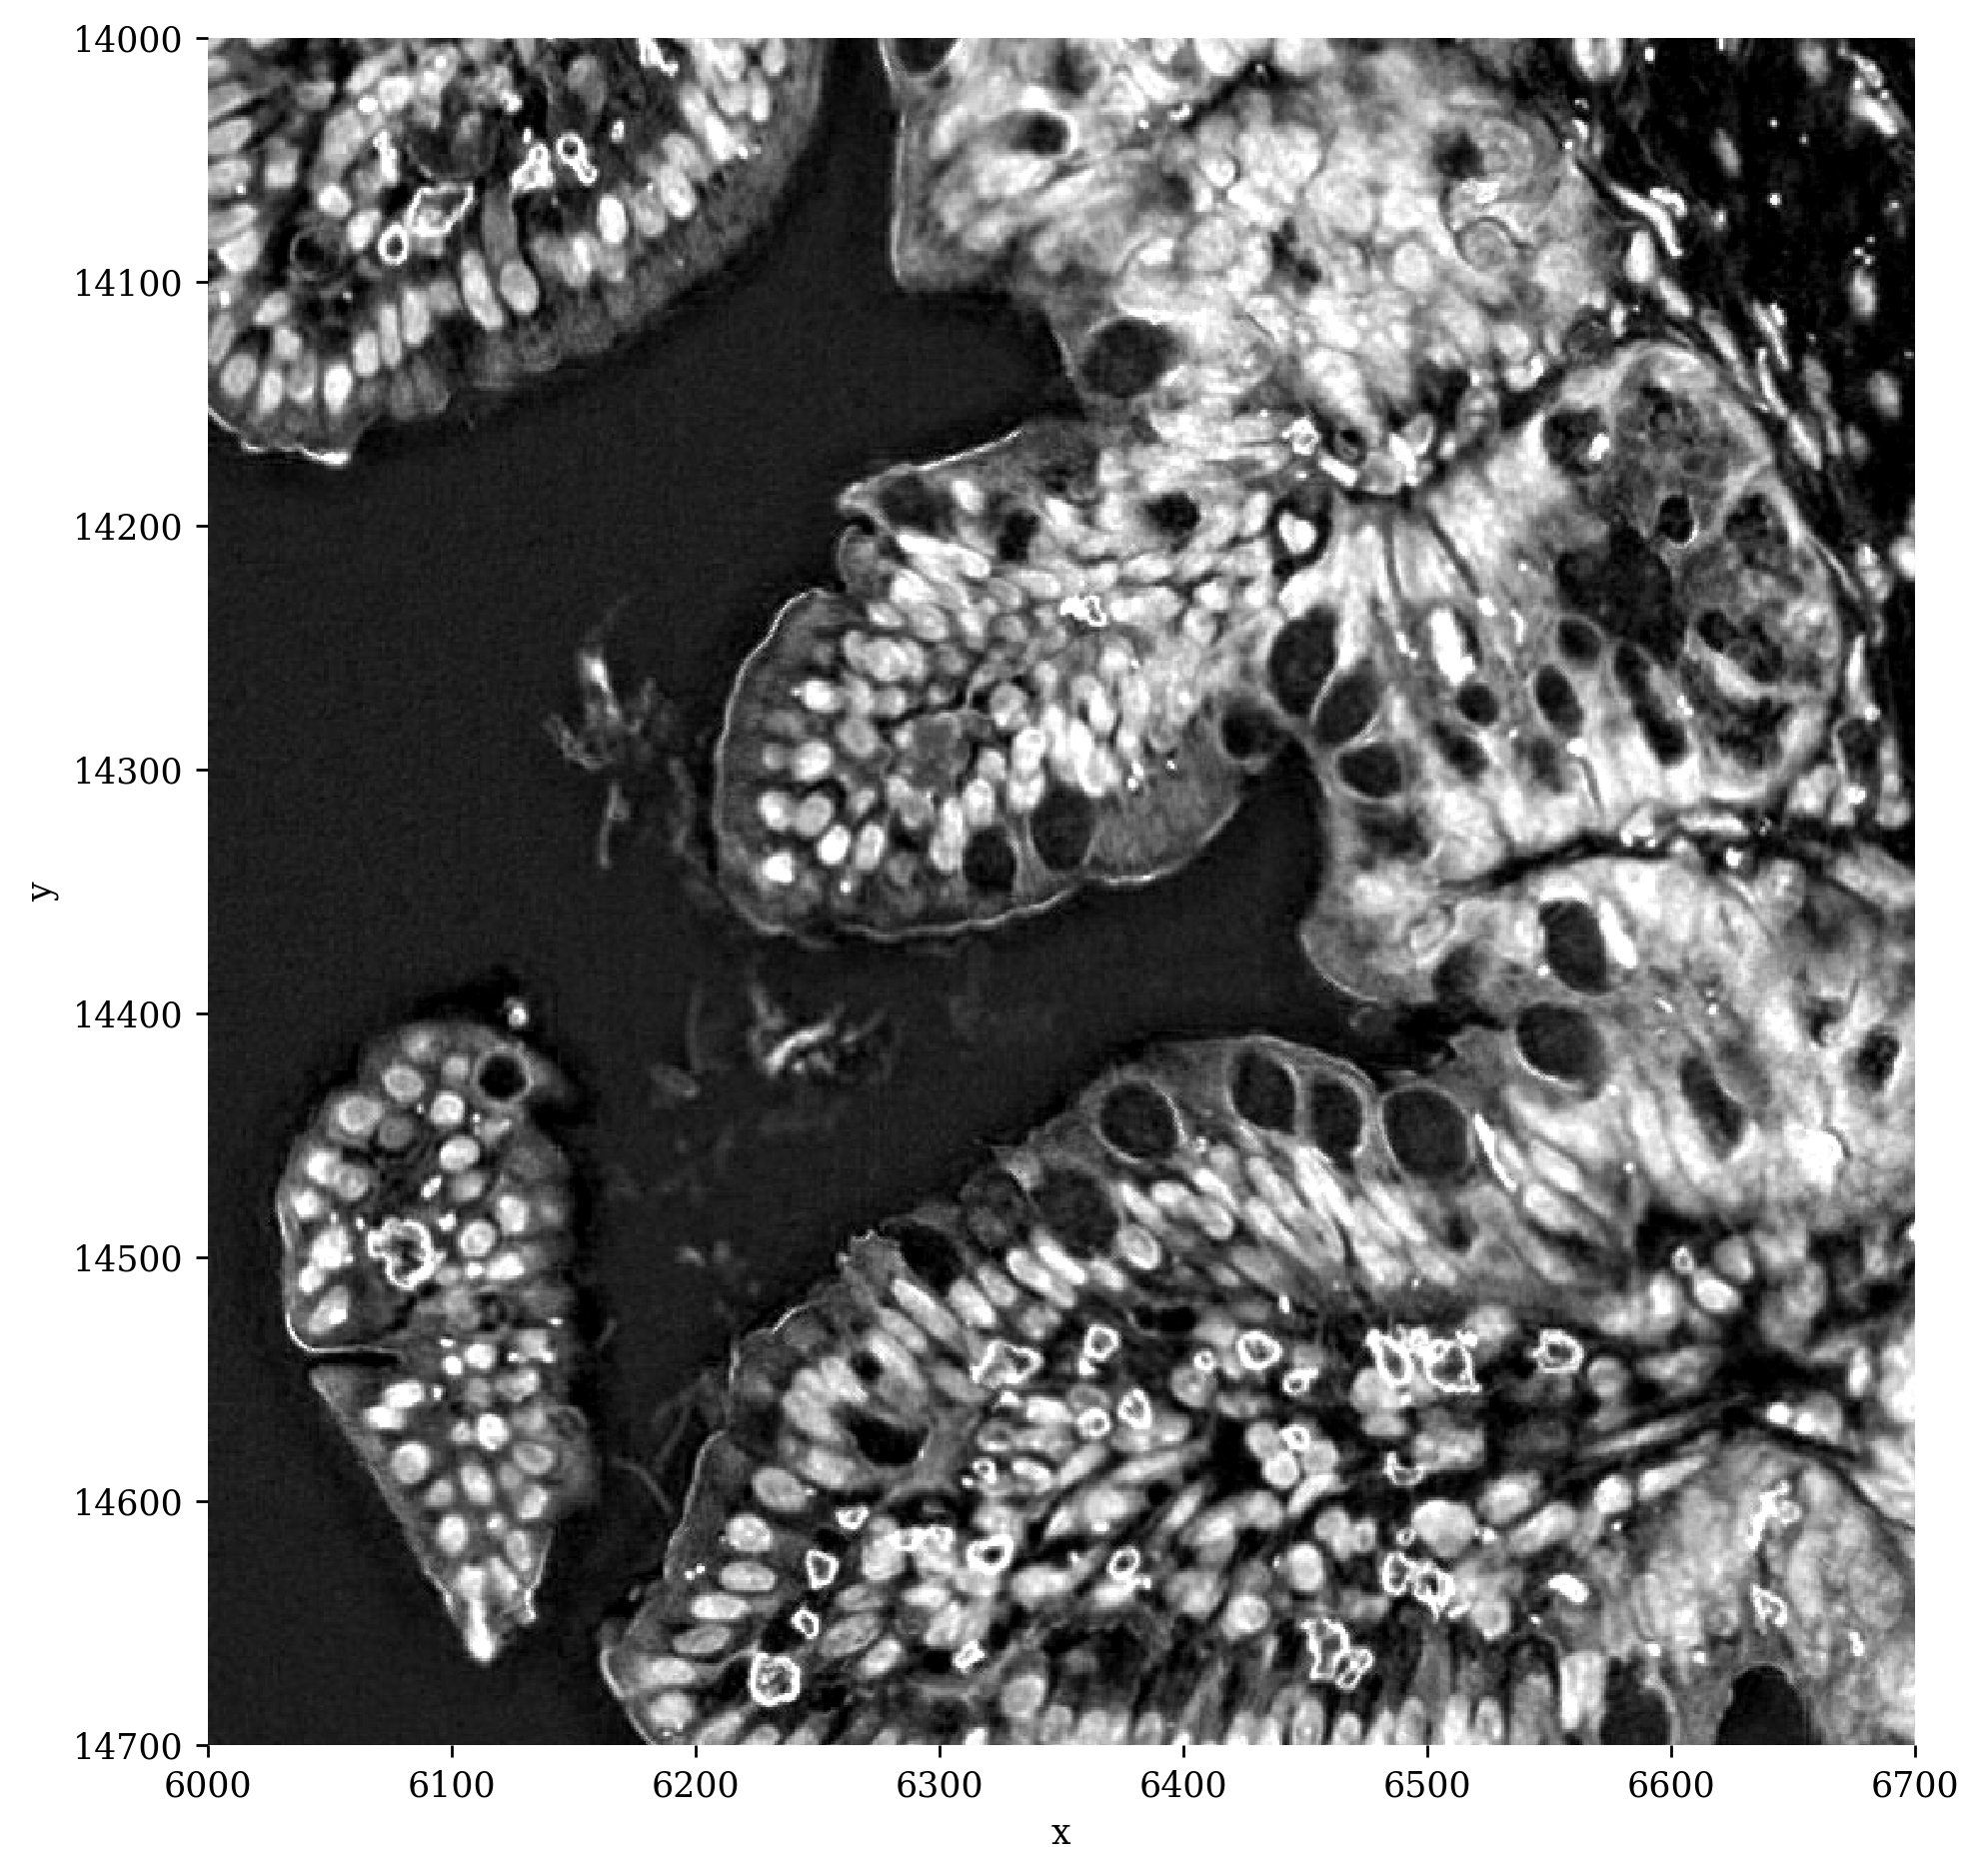
# Let's plot a crop first to see what it looks like
sp.pl.plot_image(sdata,
                 img_layer="crop_inv",
                 figsize=(8, 8),
                 crd=crd,
                 to_coordinate_system='Visium_HD_Mouse_Small_Intestine',
                 channel_title=False
                 )
Key Cellpose parameters used here:
Parameter |
Value |
Meaning |
|---|---|---|
|
|
Uses Cellpose’s built-in nuclei model |
|
|
Expected nucleus diameter in pixels; tune this to match your image resolution |
|
|
Specifies the maximum allowed error of the shape flows for each mask. Increase this threshold if cellpose is not returning as many ROIs as you’d expect. Similarly, decrease this threshold if cellpose is returning too many ill-shaped ROIs. |
|
|
Negative values make the model more sensitive, detecting more (potentially smaller) nuclei |
|
crop extent |
Limits segmentation to the crop region for fast parameter tuning; set to |
It is recommended to first optimize these parameters on a small crop before running on the full image, as the full image can take significant time to process.
# segment the crop (full image will take some time, so it's best to optimize the parameters on a crop)
sp.im.segment(
    sdata=sdata,
    img_layer="crop_inv",
    output_labels_layer="segmentation_mask",
    output_shapes_layer="segmentation_mask_boundaries",
    to_coordinate_system=COORDINATE_SYSTEM,
    flow_threshold=0.9,
    diameter=15,
    crd=crd,
    cellprob_threshold=-6,
    pretrained_model="nuclei",
    overwrite=True,
)
SpatialData object, with associated Zarr store: C:\Users\stijnb\AppData\Local\Temp\sdata_20260610_114301.zarr
├── Images
│     ├── 'Visium_HD_Mouse_Small_Intestine_full_image': DataTree[cyx] (3, 21943, 23618), (3, 10971, 11809), (3, 5485, 5904), (3, 2742, 2952), (3, 1371, 1476)
│     ├── 'Visium_HD_Mouse_Small_Intestine_hires_image': DataArray[cyx] (3, 5575, 6000)
│     ├── 'Visium_HD_Mouse_Small_Intestine_lowres_image': DataArray[cyx] (3, 558, 600)
│     └── 'crop_inv': DataArray[cyx] (1, 21943, 23618)
├── Labels
│     ├── '10X_segmentation_mask': DataArray[yx] (21702, 23331)
│     ├── 'Visium_HD_Mouse_Small_Intestine_square_002um_labels': DataArray[yx] (3285, 3191)
│     ├── 'Visium_HD_Mouse_Small_Intestine_square_008um_labels': DataArray[yx] (822, 799)
│     ├── 'Visium_HD_Mouse_Small_Intestine_square_016um_labels': DataArray[yx] (412, 400)
│     └── 'segmentation_mask': DataArray[yx] (700, 700)
├── Shapes
│     ├── '10X_segmentation_boundaries': GeoDataFrame shape: (369006, 2) (2D shapes)
│     ├── 'Visium_HD_Mouse_Small_Intestine_square_002um': GeoDataFrame shape: (5479660, 1) (2D shapes)
│     ├── 'Visium_HD_Mouse_Small_Intestine_square_008um': GeoDataFrame shape: (351817, 1) (2D shapes)
│     ├── 'Visium_HD_Mouse_Small_Intestine_square_016um': GeoDataFrame shape: (91033, 1) (2D shapes)
│     └── 'segmentation_mask_boundaries': GeoDataFrame shape: (479, 1) (2D shapes)
└── Tables
      ├── '10X_custom_binning': AnnData (359782, 19059)
      ├── 'square_002um': AnnData (5479660, 19059)
      ├── 'square_008um': AnnData (351817, 19059)
      └── 'square_016um': AnnData (91033, 19059)
with coordinate systems:
    ▸ 'Visium_HD_Mouse_Small_Intestine', with elements:
        Visium_HD_Mouse_Small_Intestine_full_image (Images), Visium_HD_Mouse_Small_Intestine_hires_image (Images), Visium_HD_Mouse_Small_Intestine_lowres_image (Images), crop_inv (Images), 10X_segmentation_mask (Labels), Visium_HD_Mouse_Small_Intestine_square_002um_labels (Labels), Visium_HD_Mouse_Small_Intestine_square_008um_labels (Labels), Visium_HD_Mouse_Small_Intestine_square_016um_labels (Labels), segmentation_mask (Labels), 10X_segmentation_boundaries (Shapes), Visium_HD_Mouse_Small_Intestine_square_002um (Shapes), Visium_HD_Mouse_Small_Intestine_square_008um (Shapes), Visium_HD_Mouse_Small_Intestine_square_016um (Shapes), segmentation_mask_boundaries (Shapes)
    ▸ 'Visium_HD_Mouse_Small_Intestine_downscaled_hires', with elements:
        Visium_HD_Mouse_Small_Intestine_hires_image (Images), Visium_HD_Mouse_Small_Intestine_square_002um_labels (Labels), Visium_HD_Mouse_Small_Intestine_square_008um_labels (Labels), Visium_HD_Mouse_Small_Intestine_square_016um_labels (Labels), Visium_HD_Mouse_Small_Intestine_square_002um (Shapes), Visium_HD_Mouse_Small_Intestine_square_008um (Shapes), Visium_HD_Mouse_Small_Intestine_square_016um (Shapes)
    ▸ 'Visium_HD_Mouse_Small_Intestine_downscaled_lowres', with elements:
        Visium_HD_Mouse_Small_Intestine_lowres_image (Images), Visium_HD_Mouse_Small_Intestine_square_002um_labels (Labels), Visium_HD_Mouse_Small_Intestine_square_008um_labels (Labels), Visium_HD_Mouse_Small_Intestine_square_016um_labels (Labels), Visium_HD_Mouse_Small_Intestine_square_002um (Shapes), Visium_HD_Mouse_Small_Intestine_square_008um (Shapes), Visium_HD_Mouse_Small_Intestine_square_016um (Shapes)
    ▸ 'global', with elements:
        crop_inv (Images), 10X_segmentation_mask (Labels), segmentation_mask (Labels), 10X_segmentation_boundaries (Shapes), segmentation_mask_boundaries (Shapes)
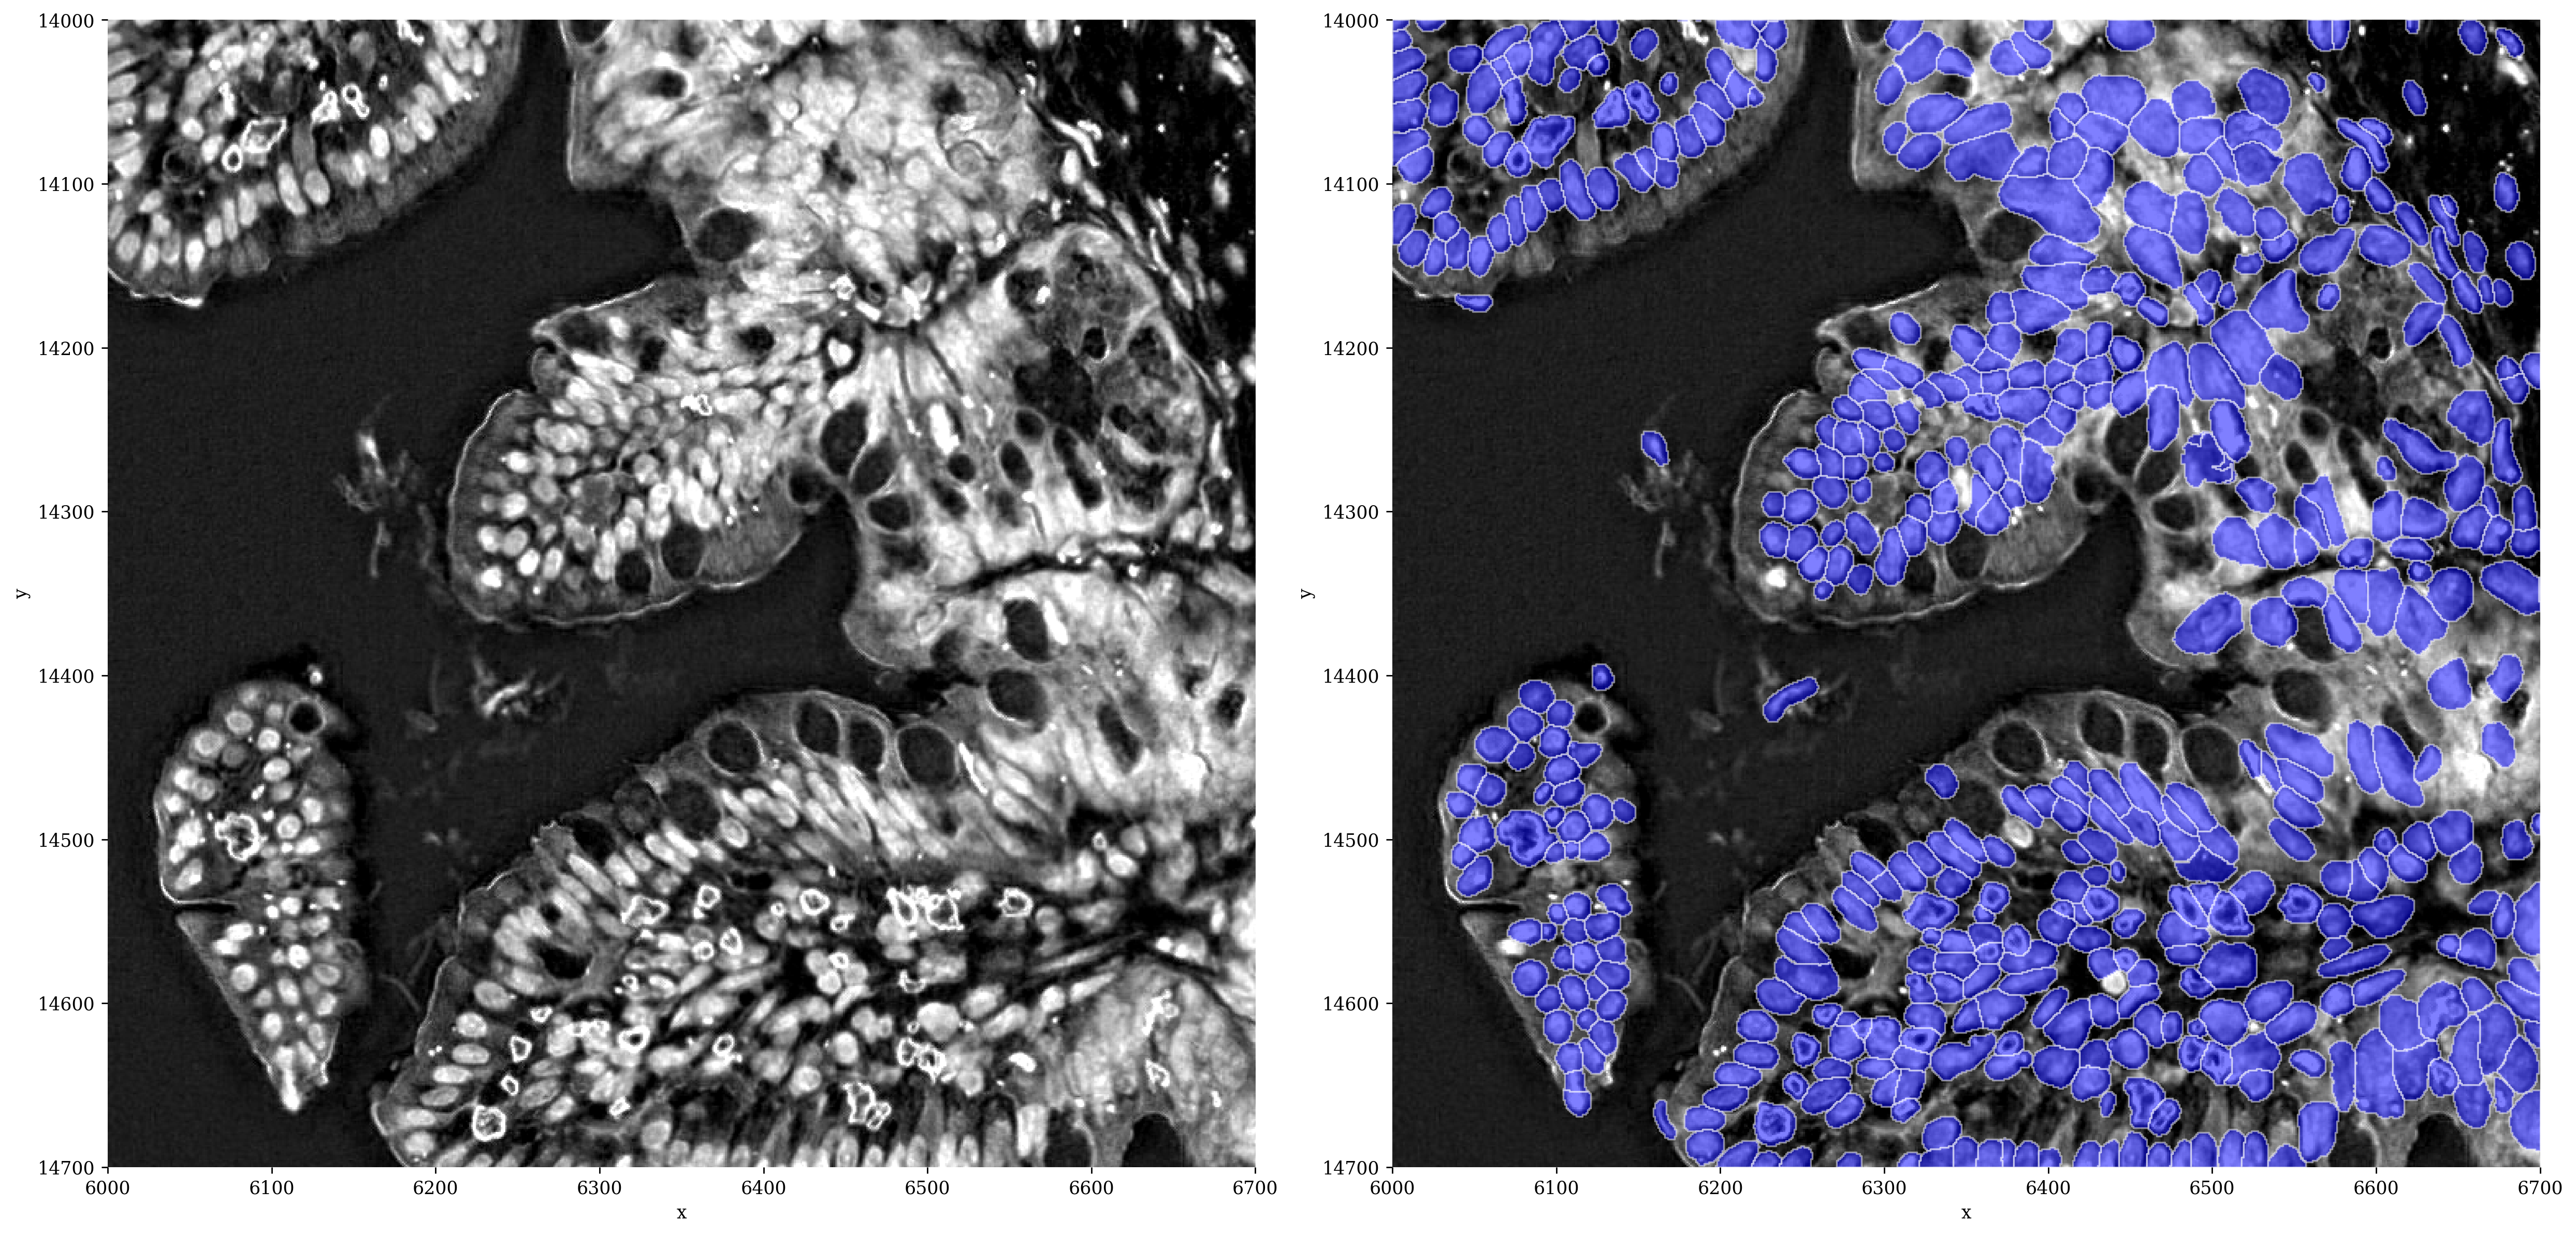
# plot the segmentation results
sp.pl.segment(sdata=sdata,
img_layer="crop_inv",
shapes_layer="segmentation_mask_boundaries",
crd=crd,
to_coordinate_system=COORDINATE_SYSTEM,
channel_title=False
)
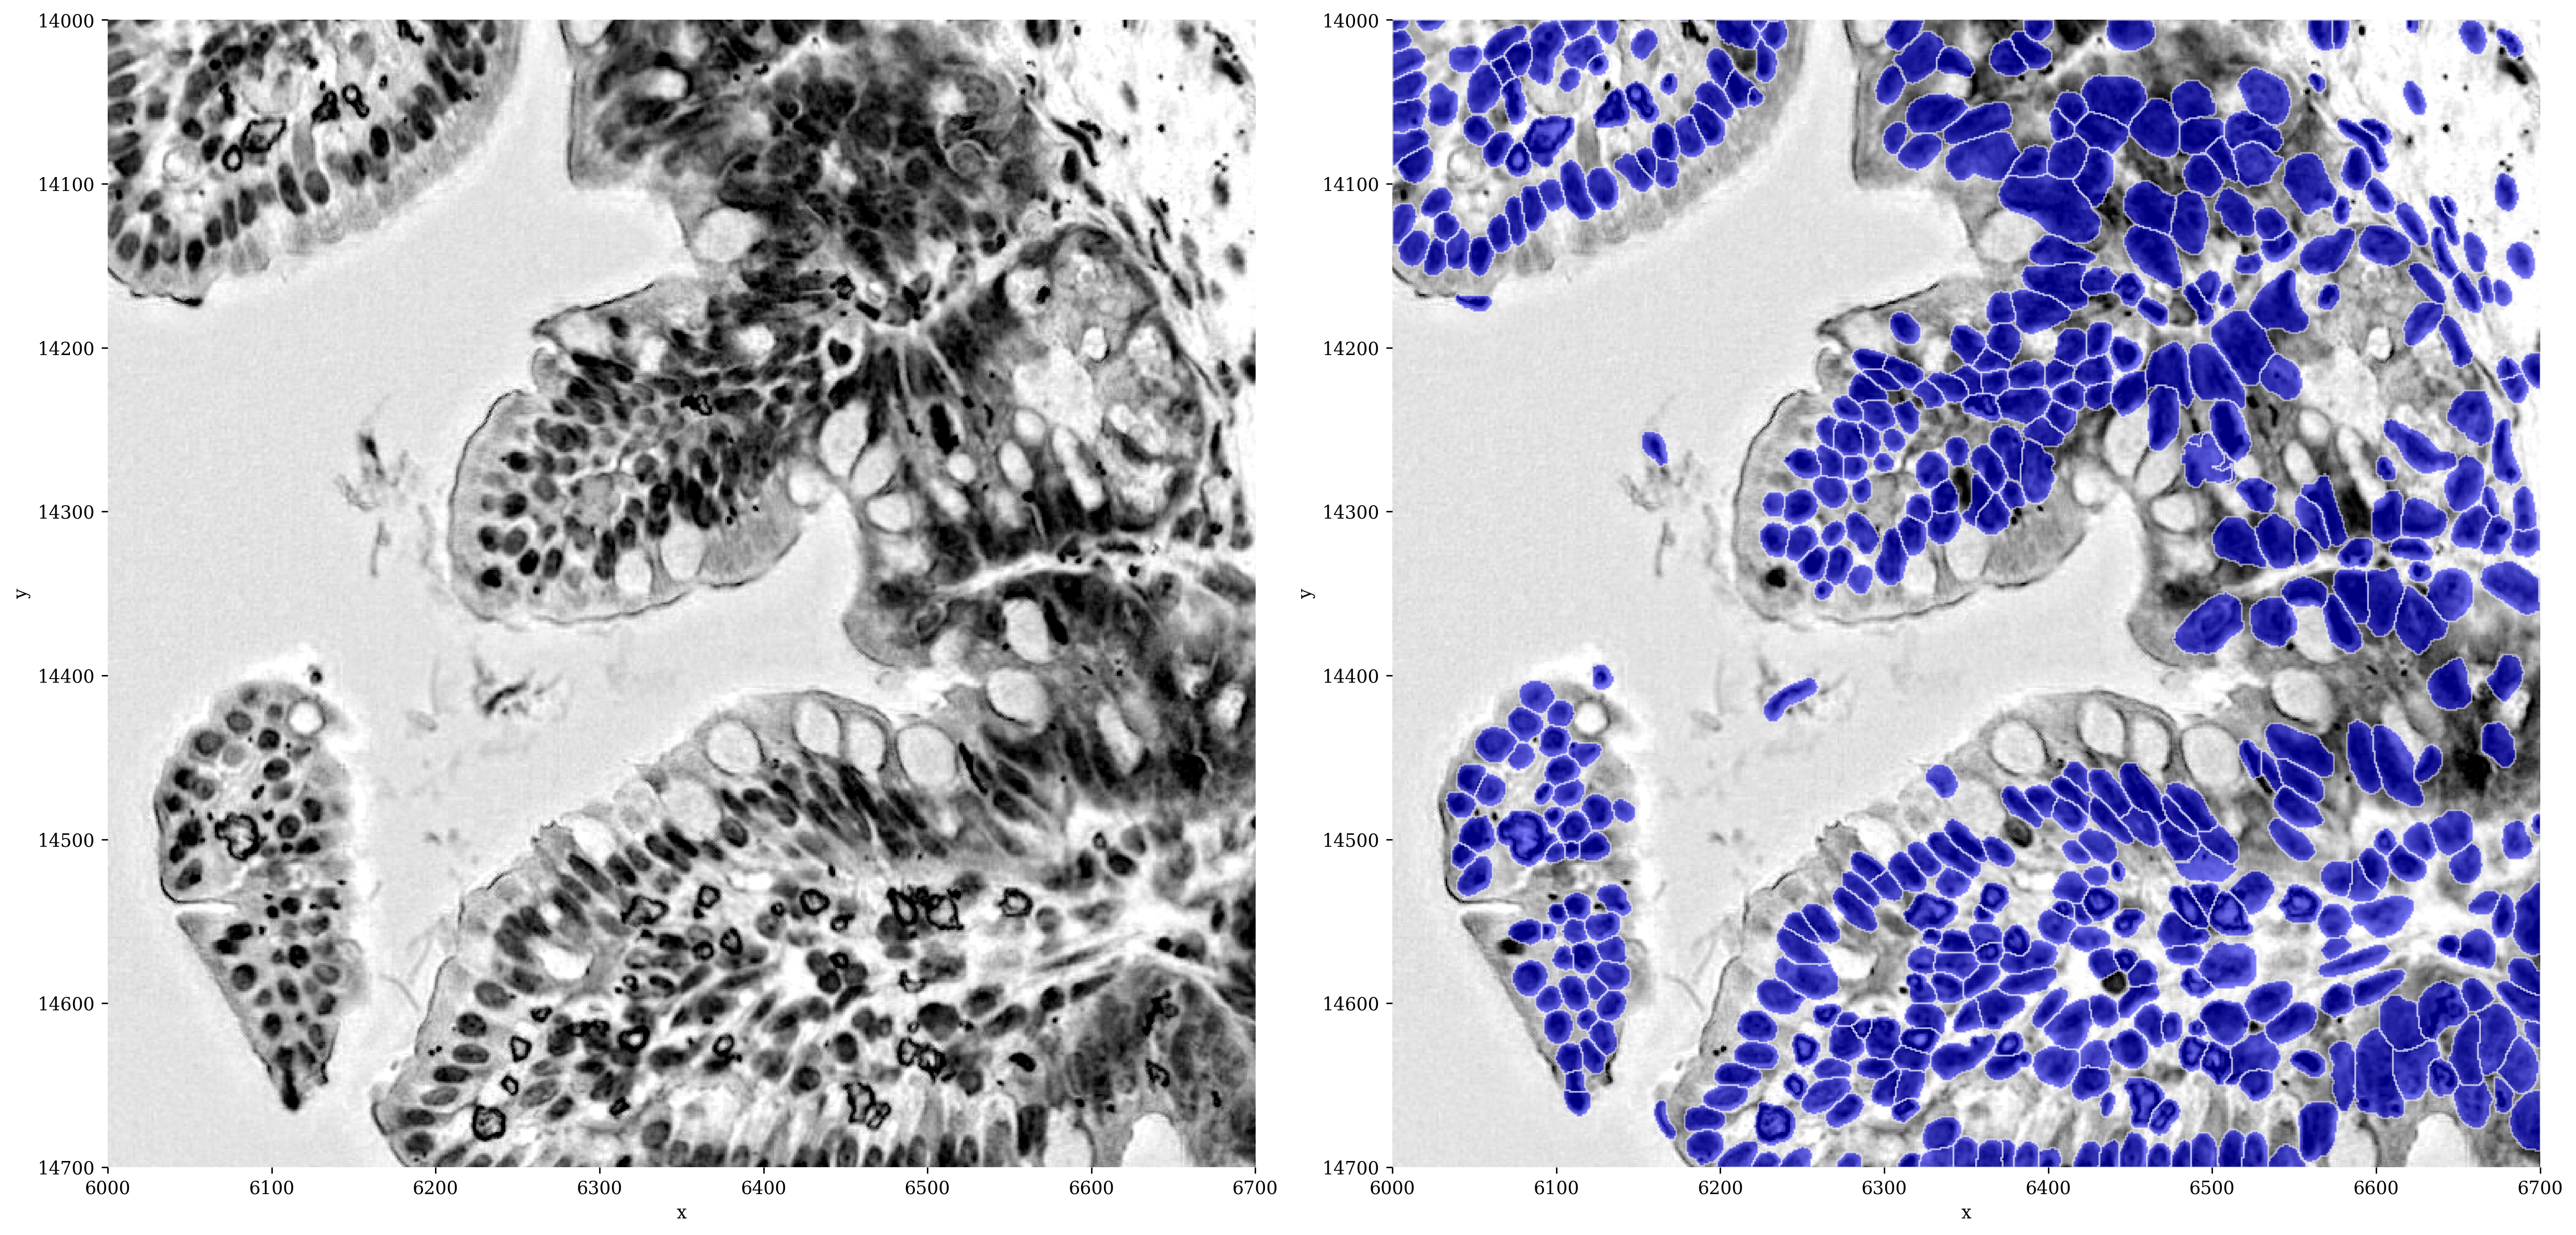
sp.pl.segment(sdata=sdata,
img_layer="Visium_HD_Mouse_Small_Intestine_full_image",
crd=crd,
shapes_layer="segmentation_mask_boundaries",
to_coordinate_system=COORDINATE_SYSTEM,
channel='r',
channel_title=False
)
# now we can again allocate the original 2x2um bins to the segmented cells
sp.tb.bin_counts(sdata,
                 table_layer='square_002um',
                 labels_layer='segmentation_mask',
                 output_layer='custom_sc_binning',
                 to_coordinate_system='Visium_HD_Mouse_Small_Intestine',
                 overwrite=True
                 )
SpatialData object, with associated Zarr store: C:\Users\stijnb\AppData\Local\Temp\sdata_20260610_114301.zarr
├── Images
│     ├── 'Visium_HD_Mouse_Small_Intestine_full_image': DataTree[cyx] (3, 21943, 23618), (3, 10971, 11809), (3, 5485, 5904), (3, 2742, 2952), (3, 1371, 1476)
│     ├── 'Visium_HD_Mouse_Small_Intestine_hires_image': DataArray[cyx] (3, 5575, 6000)
│     ├── 'Visium_HD_Mouse_Small_Intestine_lowres_image': DataArray[cyx] (3, 558, 600)
│     └── 'crop_inv': DataArray[cyx] (1, 21943, 23618)
├── Labels
│     ├── '10X_segmentation_mask': DataArray[yx] (21702, 23331)
│     ├── 'Visium_HD_Mouse_Small_Intestine_square_002um_labels': DataArray[yx] (3285, 3191)
│     ├── 'Visium_HD_Mouse_Small_Intestine_square_008um_labels': DataArray[yx] (822, 799)
│     ├── 'Visium_HD_Mouse_Small_Intestine_square_016um_labels': DataArray[yx] (412, 400)
│     └── 'segmentation_mask': DataArray[yx] (700, 700)
├── Shapes
│     ├── '10X_segmentation_boundaries': GeoDataFrame shape: (369006, 2) (2D shapes)
│     ├── 'Visium_HD_Mouse_Small_Intestine_square_002um': GeoDataFrame shape: (5479660, 1) (2D shapes)
│     ├── 'Visium_HD_Mouse_Small_Intestine_square_008um': GeoDataFrame shape: (351817, 1) (2D shapes)
│     ├── 'Visium_HD_Mouse_Small_Intestine_square_016um': GeoDataFrame shape: (91033, 1) (2D shapes)
│     └── 'segmentation_mask_boundaries': GeoDataFrame shape: (479, 1) (2D shapes)
└── Tables
      ├── '10X_custom_binning': AnnData (359782, 19059)
      ├── 'custom_sc_binning': AnnData (476, 19059)
      ├── 'square_002um': AnnData (5479660, 19059)
      ├── 'square_008um': AnnData (351817, 19059)
      └── 'square_016um': AnnData (91033, 19059)
with coordinate systems:
    ▸ 'Visium_HD_Mouse_Small_Intestine', with elements:
        Visium_HD_Mouse_Small_Intestine_full_image (Images), Visium_HD_Mouse_Small_Intestine_hires_image (Images), Visium_HD_Mouse_Small_Intestine_lowres_image (Images), crop_inv (Images), 10X_segmentation_mask (Labels), Visium_HD_Mouse_Small_Intestine_square_002um_labels (Labels), Visium_HD_Mouse_Small_Intestine_square_008um_labels (Labels), Visium_HD_Mouse_Small_Intestine_square_016um_labels (Labels), segmentation_mask (Labels), 10X_segmentation_boundaries (Shapes), Visium_HD_Mouse_Small_Intestine_square_002um (Shapes), Visium_HD_Mouse_Small_Intestine_square_008um (Shapes), Visium_HD_Mouse_Small_Intestine_square_016um (Shapes), segmentation_mask_boundaries (Shapes)
    ▸ 'Visium_HD_Mouse_Small_Intestine_downscaled_hires', with elements:
        Visium_HD_Mouse_Small_Intestine_hires_image (Images), Visium_HD_Mouse_Small_Intestine_square_002um_labels (Labels), Visium_HD_Mouse_Small_Intestine_square_008um_labels (Labels), Visium_HD_Mouse_Small_Intestine_square_016um_labels (Labels), Visium_HD_Mouse_Small_Intestine_square_002um (Shapes), Visium_HD_Mouse_Small_Intestine_square_008um (Shapes), Visium_HD_Mouse_Small_Intestine_square_016um (Shapes)
    ▸ 'Visium_HD_Mouse_Small_Intestine_downscaled_lowres', with elements:
        Visium_HD_Mouse_Small_Intestine_lowres_image (Images), Visium_HD_Mouse_Small_Intestine_square_002um_labels (Labels), Visium_HD_Mouse_Small_Intestine_square_008um_labels (Labels), Visium_HD_Mouse_Small_Intestine_square_016um_labels (Labels), Visium_HD_Mouse_Small_Intestine_square_002um (Shapes), Visium_HD_Mouse_Small_Intestine_square_008um (Shapes), Visium_HD_Mouse_Small_Intestine_square_016um (Shapes)
    ▸ 'global', with elements:
        crop_inv (Images), 10X_segmentation_mask (Labels), segmentation_mask (Labels), 10X_segmentation_boundaries (Shapes), segmentation_mask_boundaries (Shapes)
# now we can plot genes onto the individual cells
fig, ax = plt.subplots(figsize=(10, 10), dpi=plot_dpi)

_plot(
    sdata,
    ax,
    img_layer="Visium_HD_Mouse_Small_Intestine_full_image",
    shapes_layer="segmentation_mask_boundaries", # shapes layer corresponding to labels layer
    crd=crd,
    to_coordinate_system=COORDINATE_SYSTEM,
    channel="r",
    table_layer = "custom_sc_binning",
    column=gene,
)

ax.set_title(f"Visium HD mouse small intestine\n {gene} expression", fontsize=12)
plt.tight_layout()
plt.show()
We now have a genes-by-cells table, we can now do further processing steps (normalization, clustering, etc.) on this. These are covered in the general tutorial here.